\n
## Charts: Reinforcement Learning Performance Analysis
### Overview
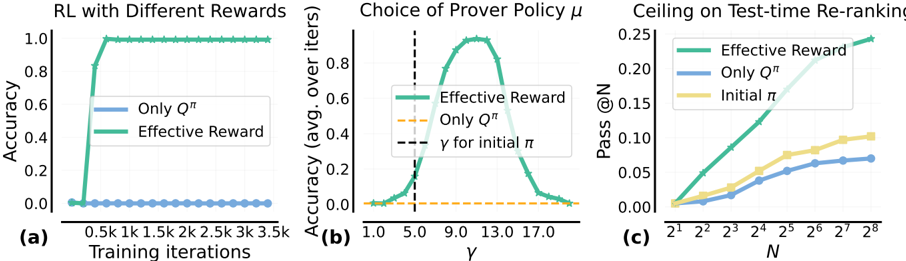
The image presents three charts (a, b, and c) analyzing the performance of Reinforcement Learning (RL) algorithms under different reward schemes and parameter settings. Chart (a) compares accuracy with different rewards over training iterations. Chart (b) examines the impact of the prover policy parameter γ on accuracy. Chart (c) investigates the effect of the test-time re-ranking parameter N on the pass rate @ N.
### Components/Axes
**Chart (a): RL with Different Rewards**
* **X-axis:** Training iterations (0.5k, 1k, 1.5k, 2k, 2.5k, 3k, 3.5k)
* **Y-axis:** Accuracy (0.0 to 1.0)
* **Legend:**
* "Only Qπ" (Blue)
* "Effective Reward" (Green)
**Chart (b): Choice of Prover Policy μ**
* **X-axis:** γ (1.0 to 17.0)
* **Y-axis:** Accuracy (avg. over iters) (0.0 to 1.0)
* **Legend:**
* "Effective Reward" (Green)
* "Only Qπ" (Orange)
* "γ for initial π" (Dashed Orange)
**Chart (c): Ceiling on Test-time Re-ranking**
* **X-axis:** N (2<sup>1</sup>, 2<sup>2</sup>, 2<sup>3</sup>, 2<sup>4</sup>, 2<sup>5</sup>, 2<sup>6</sup>, 2<sup>7</sup>, 2<sup>8</sup>) which is equivalent to (2, 4, 8, 16, 32, 64, 128, 256)
* **Y-axis:** Pass @ N (0.0 to 0.25)
* **Legend:**
* "Effective Reward" (Green)
* "Only Qπ" (Blue)
* "Initial π" (Yellow)
### Detailed Analysis or Content Details
**Chart (a): RL with Different Rewards**
* **"Only Qπ" (Blue):** The line remains relatively flat around 0.0 accuracy throughout all training iterations. Accuracy is approximately 0.02 at all points.
* **"Effective Reward" (Green):** The line shows a steep increase in accuracy from 0.0 to approximately 1.0 between 0.5k and 1.5k training iterations. After 1.5k iterations, the accuracy stabilizes around 0.98-1.0.
**Chart (b): Choice of Prover Policy μ**
* **"Effective Reward" (Green):** The line forms a bell-shaped curve, peaking at approximately γ = 9.0 with an accuracy of around 0.95. The accuracy decreases as γ moves away from 9.0 in either direction. Accuracy is approximately 0.2 at γ = 1.0 and γ = 17.0.
* **"Only Qπ" (Orange):** The line is relatively flat, with an accuracy around 0.2 across all values of γ.
* **"γ for initial π" (Dashed Orange):** A horizontal dashed line at approximately 0.2 accuracy, spanning the entire range of γ.
**Chart (c): Ceiling on Test-time Re-ranking**
* **"Effective Reward" (Green):** The line shows a generally increasing trend, starting from approximately 0.02 at N=2 and reaching approximately 0.12 at N=256. There is a slight plateau between N=64 and N=128.
* **"Only Qπ" (Blue):** The line also shows an increasing trend, but starts at a lower value (approximately 0.01 at N=2) and reaches approximately 0.10 at N=256.
* **"Initial π" (Yellow):** The line starts at approximately 0.03 at N=2 and increases to approximately 0.08 at N=256, exhibiting a slower growth rate compared to the other two lines.
### Key Observations
* In Chart (a), the "Effective Reward" scheme significantly outperforms "Only Qπ" in terms of accuracy.
* In Chart (b), the "Effective Reward" scheme is highly sensitive to the choice of γ, with optimal performance around γ = 9.0.
* In Chart (c), increasing the value of N generally improves the pass rate for all three schemes, but the "Effective Reward" scheme consistently achieves the highest pass rate.
* The "Only Qπ" scheme consistently performs worse than the "Effective Reward" scheme across all three charts.
### Interpretation
These charts demonstrate the effectiveness of the "Effective Reward" scheme in Reinforcement Learning tasks. The scheme leads to faster learning (Chart a), optimal performance with a specific parameter setting (Chart b), and higher success rates in test-time re-ranking (Chart c). The sensitivity of the "Effective Reward" scheme to the parameter γ suggests that careful tuning of this parameter is crucial for achieving optimal performance. The consistently lower performance of the "Only Qπ" scheme indicates that the additional components of the "Effective Reward" scheme provide significant benefits. The trends in Chart (c) suggest diminishing returns as N increases, indicating a potential trade-off between computational cost and performance. The dashed line in Chart (b) provides a baseline for comparison, showing the performance of the initial policy without any learning. Overall, the data suggests that the "Effective Reward" scheme is a promising approach for improving the performance of Reinforcement Learning algorithms.