## Grouped Bar Chart: AI Model and Human Accuracy Comparison
### Overview
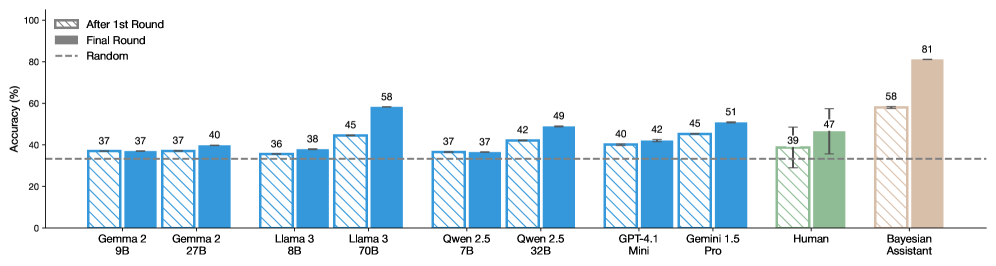
The image displays a grouped bar chart comparing the accuracy percentages of various large language models (LLMs), a human baseline, and a "Bayesian Assistant" across two evaluation rounds. The chart assesses performance on an unspecified task, with a random-guess baseline indicated.
### Components/Axes
* **Chart Type:** Grouped bar chart with error bars.
* **Y-Axis:** Labeled "Accuracy (%)". Scale runs from 0 to 100 in increments of 20.
* **X-Axis:** Lists 10 categories (9 AI models/systems + Human). From left to right:
1. Gemma 2 9B
2. Gemma 2 27B
3. Llama 3 8B
4. Llama 3 70B
5. Qwen 2.5 7B
6. Qwen 2.5 32B
7. GPT-4.1 Mini
8. Gemini 1.5 Pro
9. Human
10. Bayesian Assistant
* **Legend (Top-Left Corner):**
* **Hatched Pattern Bar:** "After 1st Round"
* **Solid Color Bar:** "Final Round"
* **Dashed Horizontal Line:** "Random"
* **Baseline:** A dashed horizontal line at approximately 33% accuracy, labeled "Random" in the legend, representing chance-level performance.
### Detailed Analysis
Each category on the X-axis has two bars. The left (hatched) bar represents accuracy after the first round, and the right (solid) bar represents final round accuracy. Numerical values are annotated above each bar.
**Data Series & Values (Accuracy %):**
| Category | After 1st Round (Hatched) | Final Round (Solid) | Trend (1st to Final) |
| :--- | :--- | :--- | :--- |
| **Gemma 2 9B** | 37 | 37 | No change |
| **Gemma 2 27B** | 37 | 40 | Slight increase (+3) |
| **Llama 3 8B** | 36 | 38 | Slight increase (+2) |
| **Llama 3 70B** | 45 | 58 | Significant increase (+13) |
| **Qwen 2.5 7B** | 37 | 37 | No change |
| **Qwen 2.5 32B** | 42 | 49 | Moderate increase (+7) |
| **GPT-4.1 Mini** | 40 | 42 | Slight increase (+2) |
| **Gemini 1.5 Pro** | 45 | 51 | Moderate increase (+6) |
| **Human** | 39 | 47 | Moderate increase (+8). **Note:** Both bars have black error bars indicating variability. |
| **Bayesian Assistant** | 58 | 81 | Very large increase (+23). This is the highest-performing category. |
**Spatial Grounding & Verification:**
* The legend is positioned in the top-left quadrant of the chart area.
* The "Random" baseline dashed line runs horizontally across the entire chart at the ~33% mark.
* The "Human" and "Bayesian Assistant" bars are colored differently (green and brown, respectively) from the blue bars used for the AI models, visually setting them apart.
* The error bars are only present on the "Human" data series, indicating measured uncertainty or variance in human performance.
### Key Observations
1. **Universal Improvement:** All categories either maintained or improved their accuracy from the "After 1st Round" to the "Final Round." No category performed worse.
2. **Performance Tiers:** A clear hierarchy is visible. The Bayesian Assistant is the top performer, followed by the largest AI models (Llama 3 70B, Gemini 1.5 Pro). Human performance and mid-sized models cluster in the middle. Smaller models (Gemma 2 9B, Qwen 2.5 7B) perform just above the random baseline.
3. **Scale Correlation:** For each model family (Gemma 2, Llama 3, Qwen 2.5), the larger parameter version (27B, 70B, 32B) outperforms its smaller counterpart in both rounds.
4. **Human vs. AI:** Human final round accuracy (47%) is surpassed by several AI models (Llama 3 70B, Qwen 2.5 32B, Gemini 1.5 Pro, Bayesian Assistant) but is higher than the smaller models.
5. **Largest Gains:** The most significant accuracy jumps between rounds were achieved by the Bayesian Assistant (+23 points) and Llama 3 70B (+13 points).
### Interpretation
This chart likely visualizes results from a multi-round reasoning or problem-solving benchmark. The "After 1st Round" score may represent initial, single-attempt performance, while the "Final Round" score reflects performance after an iterative process (e.g., self-correction, receiving feedback, or chain-of-thought refinement).
The data suggests that:
* **Iterative refinement is highly effective.** The process between rounds consistently boosts accuracy, with more capable systems (both AI and human) benefiting more dramatically.
* **Model scale matters.** Larger models within the same family show a greater capacity for improvement and higher final performance.
* **Specialized systems can excel.** The "Bayesian Assistant," which likely incorporates probabilistic reasoning or a different architectural approach, demonstrates a superior ability to leverage the iterative process, achieving near-perfect final accuracy (81%).
* **Human reasoning is variable but competitive.** The error bars on human data acknowledge individual differences. While humans are outperformed by top AI systems in this task, they still significantly outperform smaller models and the random baseline.
The chart effectively argues for the value of multi-step evaluation and highlights the performance gap between different classes of AI systems and human capability on this specific task.