## Dual-Axis Line Chart: Accuracy vs. Computation with Step Padding
### Overview
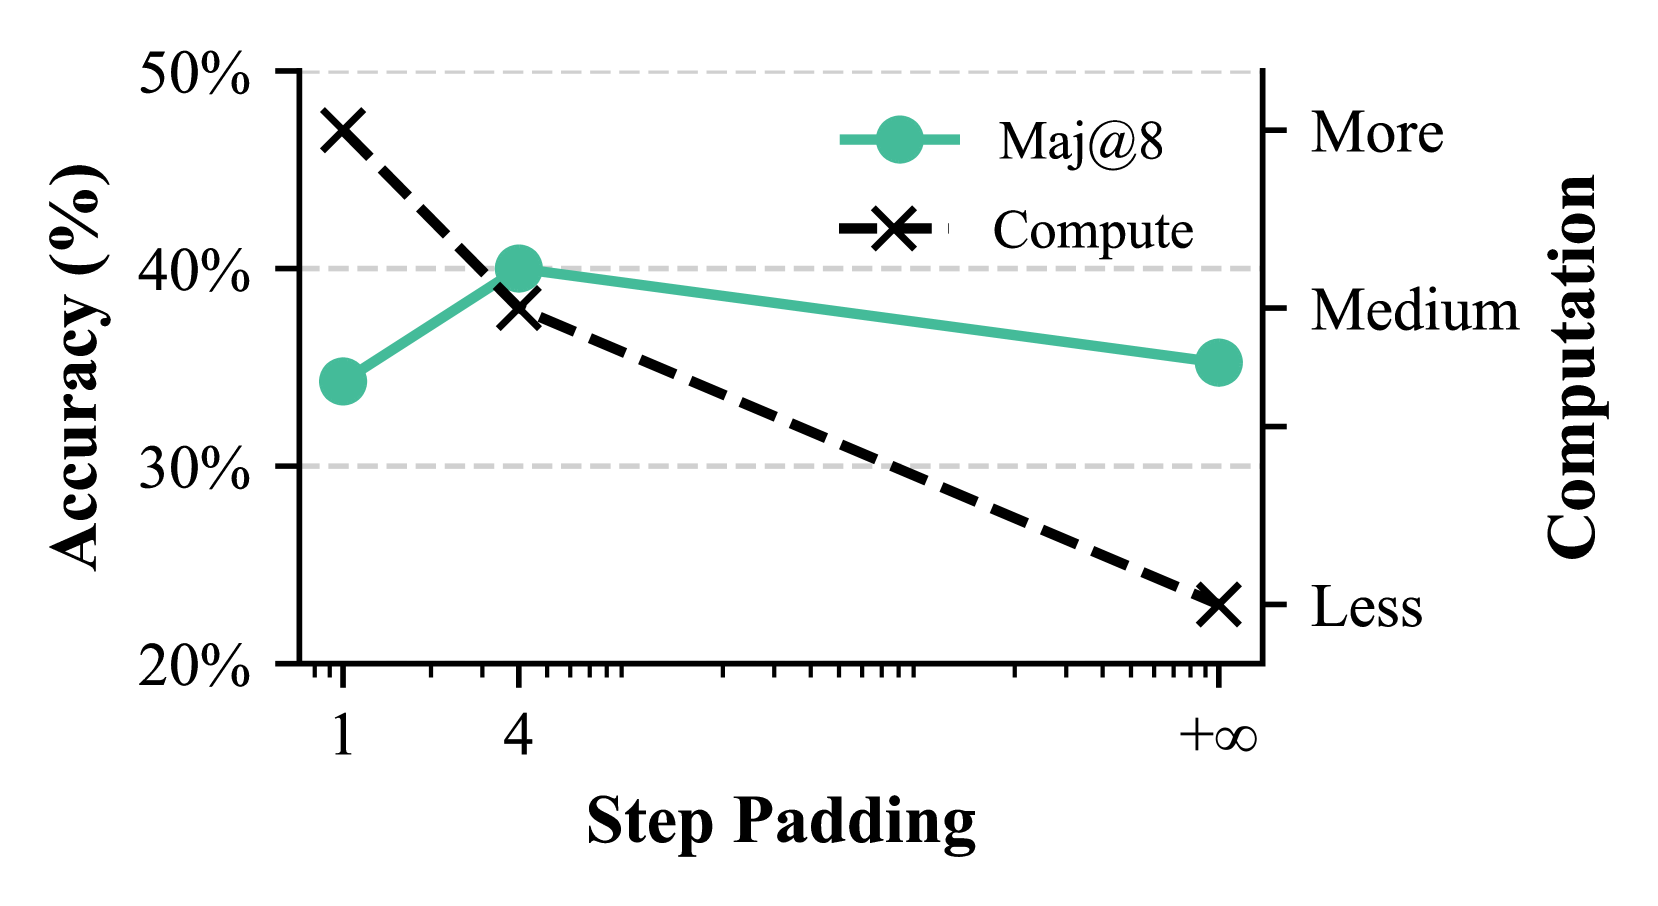
The image is a technical chart illustrating the relationship between "Step Padding" (x-axis), model "Accuracy (%)" (left y-axis), and relative "Computation" cost (right y-axis). It plots two data series: "Maj@8" (accuracy) and "Compute" (computation), showing how both metrics change as the step padding parameter increases from 1 to infinity.
### Components/Axes
* **Chart Type:** Dual-axis line chart.
* **X-Axis:**
* **Label:** "Step Padding"
* **Scale:** Categorical with three marked points: `1`, `4`, and `+∞` (plus-infinity).
* **Primary (Left) Y-Axis:**
* **Label:** "Accuracy (%)"
* **Scale:** Linear, ranging from 20% to 50%, with major gridlines at 10% intervals (20%, 30%, 40%, 50%).
* **Secondary (Right) Y-Axis:**
* **Label:** "Computation"
* **Scale:** Qualitative, with three labeled tick marks: "Less" (bottom), "Medium" (middle), "More" (top). This axis does not have numerical values.
* **Legend:** Positioned in the top-right quadrant of the chart area.
* **Maj@8:** Represented by a solid teal line with circular markers.
* **Compute:** Represented by a dashed black line with 'X' markers.
### Detailed Analysis
**Data Series 1: Maj@8 (Accuracy)**
* **Trend:** The line shows a non-monotonic trend. It increases from Step Padding 1 to 4, then decreases from 4 to +∞.
* **Data Points (Approximate):**
* At Step Padding `1`: Accuracy ≈ 34%
* At Step Padding `4`: Accuracy ≈ 40% (peak)
* At Step Padding `+∞`: Accuracy ≈ 35%
**Data Series 2: Compute (Computation)**
* **Trend:** The line shows a consistent, steep downward trend. Computation decreases significantly as step padding increases.
* **Data Points (Approximate, mapped to qualitative scale):**
* At Step Padding `1`: Computation ≈ "More" (value ~47% if mapped to left axis scale for reference).
* At Step Padding `4`: Computation ≈ "Medium" (value ~38% if mapped to left axis scale for reference).
* At Step Padding `+∞`: Computation ≈ "Less" (value ~23% if mapped to left axis scale for reference).
### Key Observations
1. **Inverse Relationship:** There is a clear inverse relationship between the "Compute" cost and "Step Padding." As step padding increases, computation decreases sharply.
2. **Accuracy Peak:** The "Maj@8" accuracy does not follow a simple linear trend. It peaks at an intermediate step padding value of 4 before declining.
3. **Trade-off Zone:** The chart highlights a trade-off zone. The highest accuracy (at Step Padding 4) coincides with a medium computation cost. The lowest computation (at +∞) comes with lower accuracy than the peak.
4. **Visual Confirmation:** The teal "Maj@8" line is positioned above the black "Compute" line at Step Padding 4 and +∞, but below it at Step Padding 1, visually reinforcing the changing trade-off.
### Interpretation
This chart demonstrates a classic engineering trade-off in model optimization, likely related to inference or sampling techniques (where "Step Padding" might refer to a parameter in a decoding algorithm like majority voting over multiple steps).
* **The Core Trade-off:** Increasing "Step Padding" from 1 to 4 improves accuracy (Maj@8) while simultaneously reducing computational cost. This suggests an initial "sweet spot" where the parameter change is beneficial on both fronts.
* **Diminishing Returns & Cost:** Beyond Step Padding 4, further increases (towards infinity) continue to reduce computation but at the cost of decreasing accuracy. This indicates a point of diminishing returns where the accuracy-computation balance shifts negatively.
* **Practical Implication:** The optimal setting depends on the priority. If maximizing accuracy is critical, Step Padding 4 is best. If minimizing computation is the primary goal, a very high step padding (+∞) is preferable, accepting a moderate drop in accuracy from the peak. The chart provides the quantitative basis for making this operational decision.