\n
## Pie Charts: Self-Judgement and Self-Difficulty Evaluation for Qwen2.5-14B-Instruct
### Overview
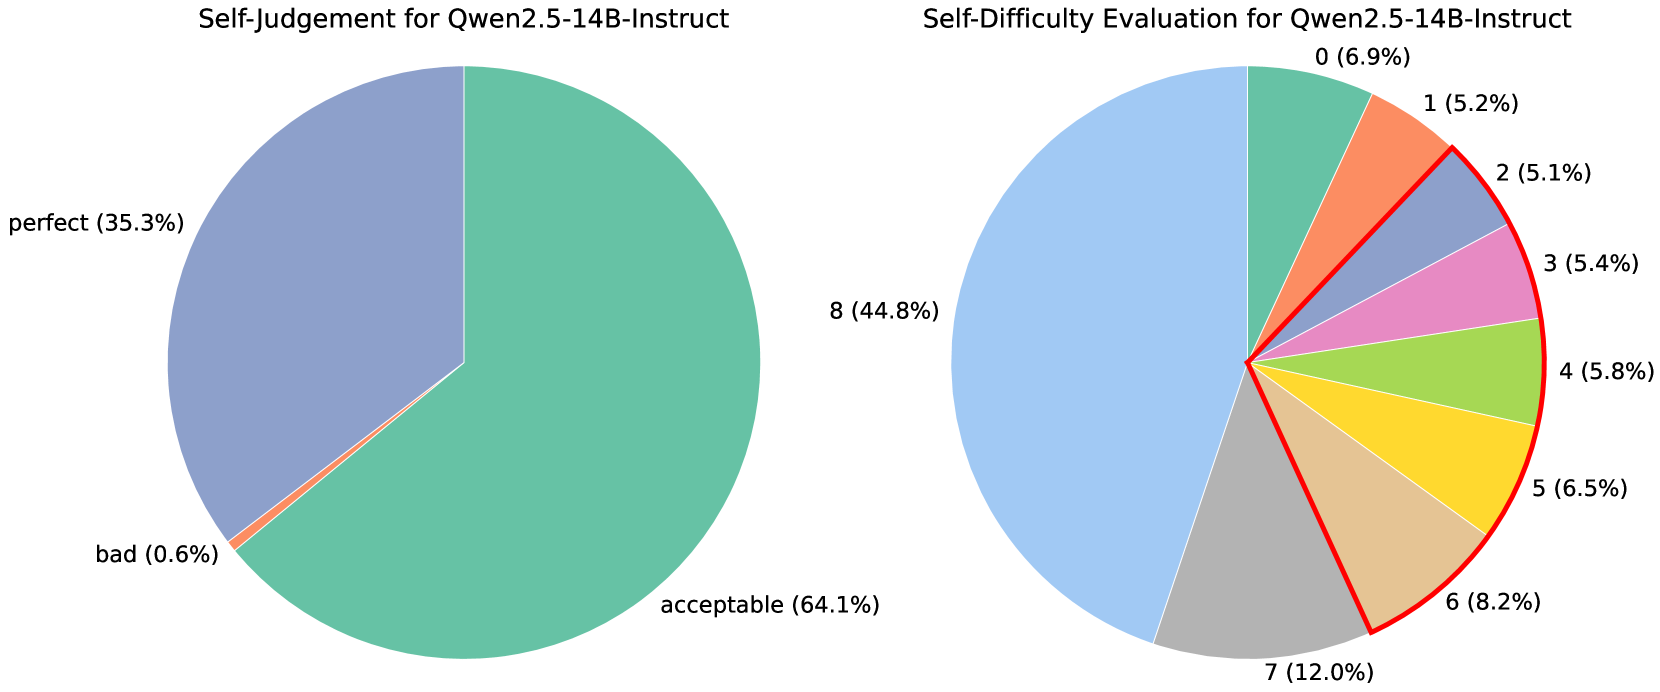
The image contains two pie charts. The left chart displays the results of a "Self-Judgement" evaluation for the Qwen2.5-14B-Instruct model. The right chart shows the "Self-Difficulty Evaluation" for the same model. Both charts represent the distribution of responses across different categories.
### Components/Axes
Both charts lack explicit axes, as they are pie charts. They are labeled with titles indicating the type of evaluation. Each slice of the pie charts is labeled with a category and its corresponding percentage.
**Left Chart (Self-Judgement):**
* Categories: "perfect", "bad"
* Percentages: 35.3%, 64.1%
**Right Chart (Self-Difficulty Evaluation):**
* Categories: 0, 1, 2, 3, 4, 5, 6, 7, 8
* Percentages: 6.9%, 5.2%, 5.1%, 5.4%, 5.8%, 5.6%, 8.2%, 12.0%, 44.8%
### Detailed Analysis or Content Details
**Left Chart (Self-Judgement):**
The pie chart is dominated by the "bad" category, representing approximately 64.1% of the responses. The "perfect" category accounts for the remaining 35.3%.
**Right Chart (Self-Difficulty Evaluation):**
The largest segment of this pie chart is the "8" category, representing 44.8% of the responses. The remaining categories are distributed as follows:
* 0: 6.9%
* 1: 5.2%
* 2: 5.1%
* 3: 5.4%
* 4: 5.8%
* 5: 5.6%
* 6: 8.2%
* 7: 12.0%
### Key Observations
* The model frequently self-judges its responses as "bad" (64.1%).
* The most common self-assessed difficulty level is 8 (44.8%).
* The distribution of difficulty levels is relatively even across the lower levels (0-7), with a slight increase in responses for difficulty level 7 (12.0%).
### Interpretation
The data suggests that the Qwen2.5-14B-Instruct model tends to be critical of its own responses, frequently rating them as "bad". This could indicate a conservative self-assessment strategy or a genuine awareness of limitations in its performance. The concentration of responses at difficulty level 8 suggests that the model often perceives tasks as moderately challenging. The relatively even distribution of lower difficulty levels indicates that the model encounters a range of task complexities. The fact that the model rates itself as "bad" more often than "perfect" could be a sign of a well-calibrated model that doesn't overestimate its capabilities. Further investigation would be needed to understand the specific types of responses that are categorized as "bad" and the characteristics of tasks assigned a difficulty level of 8.