## Pie Charts: Self-Evaluation Metrics for Qwen2.5-14B-Instruct
### Overview
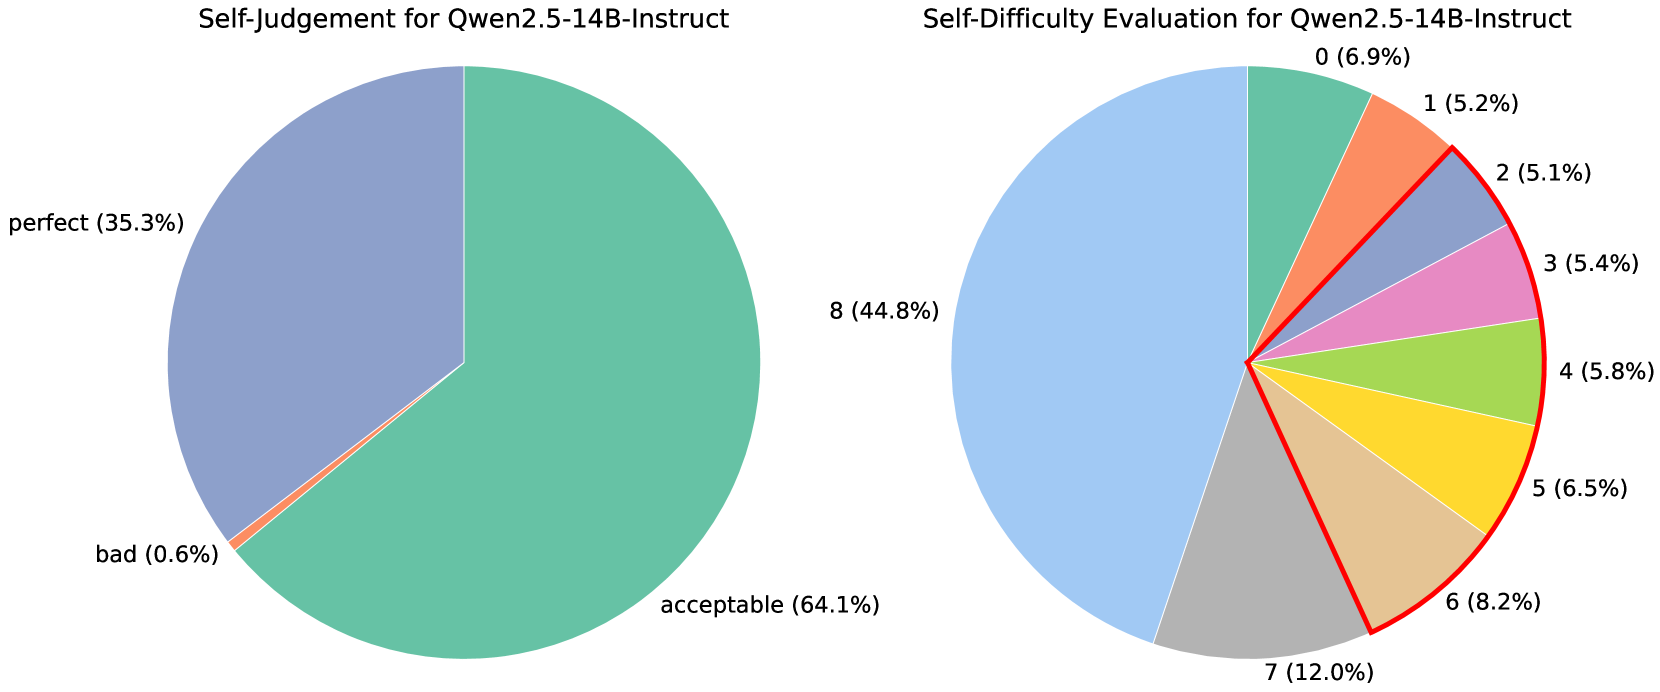
The image displays two pie charts side-by-side, presenting self-evaluation data for the AI model "Qwen2.5-14B-Instruct." The left chart assesses the model's self-judgment of its response quality, while the right chart evaluates the model's self-assessed difficulty of the tasks it was given.
### Components/Axes
**Left Chart: Self-Judgement for Qwen2.5-14B-Instruct**
* **Type:** Pie chart.
* **Categories & Data:**
* **acceptable:** 64.1% (Large, teal-green segment, occupying the right and bottom portion of the chart).
* **perfect:** 35.3% (Large, slate-blue segment, occupying the top-left portion of the chart).
* **bad:** 0.6% (Very thin, orange sliver between the "perfect" and "acceptable" segments).
* **Legend/Labels:** Labels are placed directly adjacent to their corresponding pie slices.
**Right Chart: Self-Difficulty Evaluation for Qwen2.5-14B-Instruct**
* **Type:** Pie chart.
* **Categories & Data (from 12 o'clock position, moving clockwise):**
* **0:** 6.9% (Teal-green segment).
* **1:** 5.2% (Orange segment).
* **2:** 5.1% (Slate-blue segment).
* **3:** 5.4% (Pink segment).
* **4:** 5.8% (Light green segment).
* **5:** 6.5% (Yellow segment).
* **6:** 8.2% (Tan/beige segment).
* **7:** 12.0% (Grey segment).
* **8:** 44.8% (Large, light blue segment, occupying the left half of the chart).
* **Legend/Labels:** Labels are placed directly adjacent to their corresponding pie slices. The segments for difficulty levels 0 through 6 are outlined with a thin red border, visually grouping them together.
### Detailed Analysis
**Self-Judgement (Left Chart):**
The model's self-assessment is overwhelmingly positive. The vast majority of its responses (99.4%) are categorized as either "acceptable" (64.1%) or "perfect" (35.3%). The "bad" category is negligible at 0.6%. The visual trend shows a clear dominance of the "acceptable" category, followed by a substantial "perfect" category.
**Self-Difficulty Evaluation (Right Chart):**
The model's self-assessed task difficulty shows a strong skew towards higher difficulty levels. The single largest segment is for the highest difficulty rating, "8," which accounts for nearly half (44.8%) of all evaluations. The next most common ratings are "7" (12.0%) and "6" (8.2%). The lower difficulty ratings (0 through 5) each constitute between approximately 5% and 7% of the total, showing a relatively even but minor distribution. The visual trend is a clear concentration of mass on the left side of the chart (ratings 7 and 8), indicating the model frequently perceives its tasks as highly difficult.
### Key Observations
1. **High Confidence, High Perceived Difficulty:** There is a striking contrast between the two charts. The model judges its output quality very highly (left chart) while simultaneously rating the difficulty of the tasks it performs as very high (right chart).
2. **Concentration at Extremes:** Both charts show concentration at specific points. The left chart concentrates on "acceptable" and "perfect." The right chart concentrates heavily on the maximum difficulty rating of "8."
3. **Minimal Negative Self-Assessment:** The "bad" category in the self-judgment chart is almost non-existent (0.6%).
4. **Grouping of Lower Difficulties:** The red outline on the right chart visually groups difficulty levels 0-6, separating them from the dominant 7 and 8 categories. This emphasizes the dichotomy between "lower" and "higher" difficulty as perceived by the model.
### Interpretation
The data suggests a model with a strong positive self-bias in its output quality assessment. It consistently rates its own responses as acceptable or perfect. Concurrently, it exhibits a form of "task difficulty inflation," where it perceives the problems it solves as being very challenging, with nearly half rated at the maximum difficulty.
This combination could indicate several underlying factors:
* **Calibration Issue:** The model may not be well-calibrated; its internal confidence (reflected in high-quality self-judgment) does not align with an objective measure of task difficulty. It might be overestimating task complexity.
* **Training Data Reflection:** The high perceived difficulty might reflect the nature of the tasks in its training or evaluation set, which could be inherently complex.
* **Architectural or Behavioral Trait:** This pattern could be a characteristic of the Qwen2.5-14B-Instruct model's training objective or reinforcement learning from human feedback (RLHF) process, encouraging confident outputs while acknowledging task complexity.
The near absence of "bad" self-judgments is notable and could imply either exceptional performance or a systematic bias against negative self-evaluation. The clear visual separation of difficulty levels 0-6 from 7-8 in the right chart underscores that the model's experience is dominated by tasks it considers highly difficult, yet it believes it handles them with acceptable to perfect quality.