## Chart: Agent Performance Comparison
### Overview
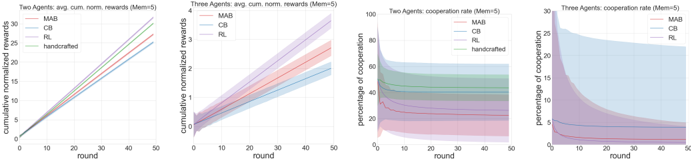
The image presents four line charts comparing the performance of different agents (MAB, CB, RL, and handcrafted) in two scenarios: two agents and three agents. The charts depict cumulative normalized rewards and cooperation rates over 50 rounds. Shaded areas around the lines indicate variability or confidence intervals.
### Components/Axes
**Chart 1: Two Agents: avg. cum. norm. rewards (Mem=5)**
* **X-axis:** round (0 to 50)
* **Y-axis:** cumulative normalized rewards (0 to 30)
* **Legend (top-left):**
* MAB (red)
* CB (blue)
* RL (purple)
* handcrafted (green)
**Chart 2: Three Agents: avg. cum. norm. rewards (Mem=5)**
* **X-axis:** round (0 to 50)
* **Y-axis:** cumulative normalized rewards (0 to 4)
* **Legend (top-left):**
* MAB (red)
* CB (blue)
* RL (purple)
**Chart 3: Two Agents: cooperation rate (Mem=5)**
* **X-axis:** round (0 to 50)
* **Y-axis:** percentage of cooperation (0 to 100)
* **Legend (top-right):**
* MAB (red)
* CB (blue)
* RL (purple)
* handcrafted (green)
**Chart 4: Three Agents: cooperation rate (Mem=5)**
* **X-axis:** round (0 to 50)
* **Y-axis:** percentage of cooperation (0 to 30)
* **Legend (top-right):**
* MAB (red)
* CB (blue)
* RL (purple)
### Detailed Analysis
**Chart 1: Two Agents: avg. cum. norm. rewards (Mem=5)**
* **MAB (red):** Linearly increasing from approximately 0 to 28 over 50 rounds.
* **CB (blue):** Linearly increasing from approximately 0 to 25 over 50 rounds.
* **RL (purple):** Linearly increasing from approximately 0 to 29 over 50 rounds.
* **handcrafted (green):** Linearly increasing from approximately 0 to 31 over 50 rounds.
**Chart 2: Three Agents: avg. cum. norm. rewards (Mem=5)**
* **MAB (red):** Increasing from approximately 0 to 2 over 50 rounds, with a shaded area indicating variability.
* **CB (blue):** Increasing from approximately 0 to 1.5 over 50 rounds, with a shaded area indicating variability.
* **RL (purple):** Increasing from approximately 0 to 2.5 over 50 rounds, with a shaded area indicating variability.
**Chart 3: Two Agents: cooperation rate (Mem=5)**
* **MAB (red):** Decreasing from approximately 20 to 5 over 50 rounds, with a shaded area indicating variability.
* **CB (blue):** Decreasing from approximately 30 to 10 over 50 rounds, with a shaded area indicating variability.
* **RL (purple):** Decreasing from approximately 30 to 10 over 50 rounds, with a shaded area indicating variability.
* **handcrafted (green):** Decreasing from approximately 80 to 50 over 50 rounds, with a shaded area indicating variability.
**Chart 4: Three Agents: cooperation rate (Mem=5)**
* **MAB (red):** Decreasing from approximately 5 to 1 over 50 rounds, with a shaded area indicating variability.
* **CB (blue):** Relatively constant at approximately 5 over 50 rounds, with a shaded area indicating variability.
* **RL (purple):** Decreasing from approximately 30 to 5 over 50 rounds, with a shaded area indicating variability.
### Key Observations
* In the two-agent reward scenario, the handcrafted agent achieves the highest cumulative normalized rewards, closely followed by RL and MAB. CB performs slightly worse.
* In the three-agent reward scenario, RL achieves the highest cumulative normalized rewards, followed by MAB and then CB. The rewards are significantly lower compared to the two-agent scenario.
* In the two-agent cooperation rate scenario, the handcrafted agent starts with a high cooperation rate but decreases over time. MAB, CB, and RL all start with lower cooperation rates and decrease over time.
* In the three-agent cooperation rate scenario, RL starts with a high cooperation rate that decreases significantly over time. MAB and CB have low and relatively constant cooperation rates.
### Interpretation
The charts suggest that the handcrafted agent performs well in the two-agent reward scenario but has a high initial cooperation rate that decreases over time. RL performs well in both reward scenarios but has a high initial cooperation rate that decreases significantly in the three-agent scenario. MAB and CB generally have lower rewards and cooperation rates compared to RL and the handcrafted agent. The three-agent scenario results in lower rewards and cooperation rates compared to the two-agent scenario, indicating increased complexity or competition among the agents. The shaded areas indicate the variability in the performance of the agents, which should be considered when interpreting the results.