## Chart Type: Model Confidence Histograms and Calibration Plots
### Overview
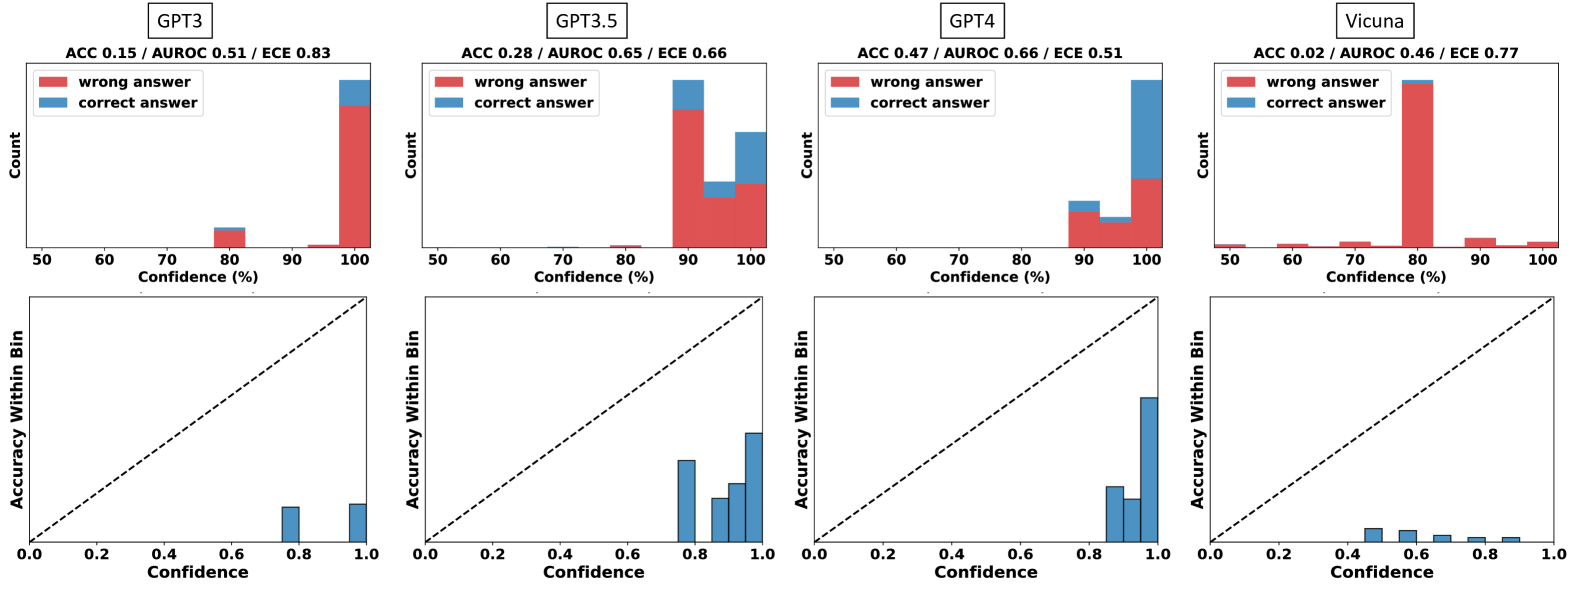
The image presents a set of histograms and calibration plots comparing the confidence levels of four different language models: GPT-3, GPT-3.5, GPT-4, and Vicuna. Each model has a histogram showing the distribution of its confidence scores for correct and incorrect answers, along with a calibration plot displaying the accuracy within each confidence bin. The plots are arranged in a 2x4 grid, with histograms in the top row and calibration plots in the bottom row.
### Components/Axes
**Histograms (Top Row):**
* **Title:** Each histogram is titled with the model name (GPT-3, GPT-3.5, GPT-4, Vicuna) and performance metrics (ACC, AUROC, ECE).
* **Y-axis:** "Count" - Represents the number of predictions falling into each confidence bin.
* **X-axis:** "Confidence (%)" - Represents the confidence level of the model, ranging from 50% to 100% in increments of 10%.
* **Legend (Top-Left of each histogram):**
* Red: "wrong answer"
* Blue: "correct answer"
**Calibration Plots (Bottom Row):**
* **Y-axis:** "Accuracy Within Bin" - Represents the accuracy of the model for predictions within a specific confidence bin, ranging from 0.0 to 1.0.
* **X-axis:** "Confidence" - Represents the confidence level, ranging from 0.0 to 1.0.
* **Diagonal Dashed Line:** Represents perfect calibration (accuracy equals confidence).
### Detailed Analysis
**GPT-3:**
* **Histogram:**
* ACC 0.15 / AUROC 0.51 / ECE 0.83
* The "wrong answer" (red) bar is very high at 100% confidence.
* A small "correct answer" (blue) bar is present at 80% confidence.
* **Calibration Plot:**
* Accuracy Within Bin is approximately 0.1 for a confidence of 0.8.
* Accuracy Within Bin is approximately 0.1 for a confidence of 1.0.
* The model is poorly calibrated, with accuracy significantly lower than confidence.
**GPT-3.5:**
* **Histogram:**
* ACC 0.28 / AUROC 0.65 / ECE 0.66
* The "wrong answer" (red) bar is high at 100% confidence.
* A significant "correct answer" (blue) bar is present at 90-100% confidence.
* **Calibration Plot:**
* Accuracy Within Bin is approximately 0.7 for a confidence of 0.8.
* Accuracy Within Bin is approximately 0.8 for a confidence of 0.9.
* Accuracy Within Bin is approximately 0.9 for a confidence of 1.0.
* The model shows better calibration than GPT-3, but still overconfident.
**GPT-4:**
* **Histogram:**
* ACC 0.47 / AUROC 0.66 / ECE 0.51
* The "wrong answer" (red) bar is high at 100% confidence.
* A significant "correct answer" (blue) bar is present at 90-100% confidence.
* **Calibration Plot:**
* Accuracy Within Bin is approximately 0.8 for a confidence of 0.8.
* Accuracy Within Bin is approximately 0.9 for a confidence of 0.9.
* Accuracy Within Bin is approximately 0.9 for a confidence of 1.0.
* The model shows better calibration than GPT-3, and GPT-3.5, but still overconfident.
**Vicuna:**
* **Histogram:**
* ACC 0.02 / AUROC 0.46 / ECE 0.77
* The "wrong answer" (red) bar is very high at 80% confidence.
* A small "correct answer" (blue) bar is present at 80% confidence.
* **Calibration Plot:**
* Accuracy Within Bin is approximately 0.0 for a confidence of 0.4.
* Accuracy Within Bin is approximately 0.0 for a confidence of 0.5.
* Accuracy Within Bin is approximately 0.0 for a confidence of 0.6.
* Accuracy Within Bin is approximately 0.0 for a confidence of 0.7.
* Accuracy Within Bin is approximately 0.0 for a confidence of 0.8.
* Accuracy Within Bin is approximately 0.0 for a confidence of 0.9.
* Accuracy Within Bin is approximately 0.0 for a confidence of 1.0.
* The model is poorly calibrated, with accuracy significantly lower than confidence.
### Key Observations
* All models tend to be overconfident, especially at higher confidence levels.
* GPT-4 exhibits the best calibration among the four models, as its accuracy within each bin is closest to the confidence level.
* GPT-3 and Vicuna are poorly calibrated, with accuracy lagging significantly behind confidence.
* The histograms show that most predictions cluster at high confidence levels, particularly for incorrect answers.
### Interpretation
The data suggests that while these language models can achieve high confidence in their predictions, their confidence is not always well-aligned with their actual accuracy. This is a common issue in machine learning, known as overconfidence. The calibration plots provide a visual representation of this phenomenon, highlighting the discrepancy between predicted confidence and actual accuracy. GPT-4 demonstrates better calibration compared to the other models, indicating that its confidence scores are more reliable. The high concentration of incorrect answers at high confidence levels suggests that these models may struggle with certain types of questions or scenarios, leading to overconfident but ultimately wrong predictions. The ECE (Expected Calibration Error) values, given in the titles, quantify the calibration error, with lower values indicating better calibration.