## Line Chart: Model Performance Across Multiple Benchmarks
### Overview
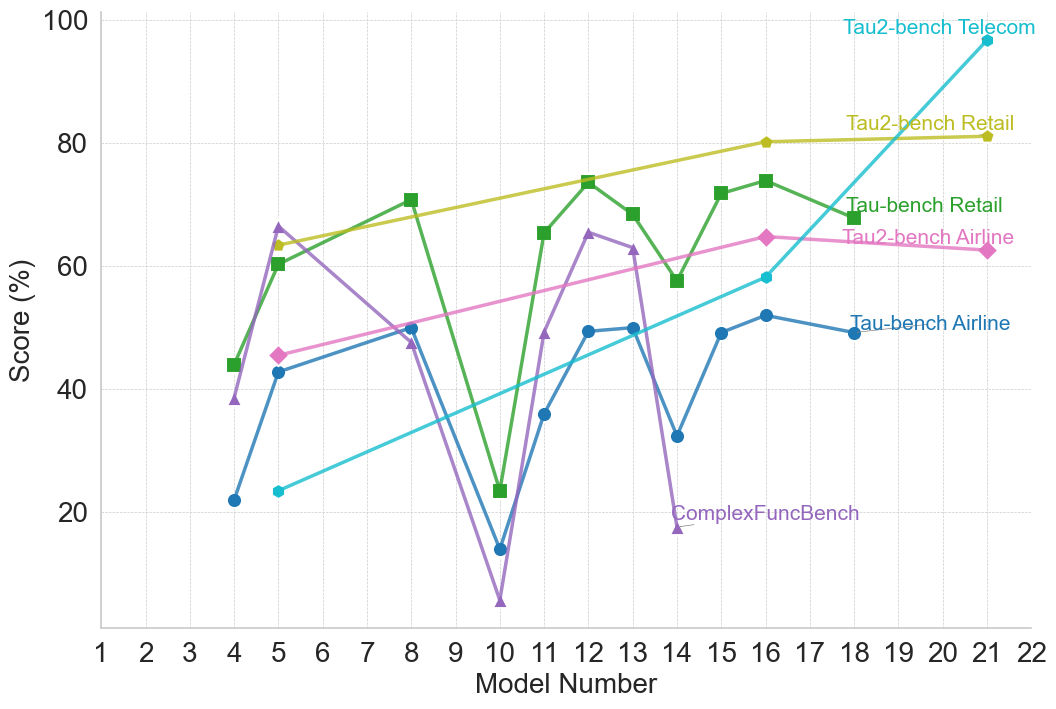
The image is a line chart plotting the performance scores (in percentage) of various AI models, identified by sequential "Model Number" on the x-axis, across six different benchmark tasks. The chart illustrates comparative performance and trends for each benchmark as model numbers increase.
### Components/Axes
* **X-Axis:** Labeled "Model Number". The scale runs from 1 to 22, with major tick marks and labels at every integer from 1 to 22.
* **Y-Axis:** Labeled "Score (%)". The scale runs from 0 to 100, with major grid lines and labels at intervals of 20 (0, 20, 40, 60, 80, 100).
* **Legend:** Positioned in the top-right quadrant of the chart area. It lists six data series with corresponding colors and marker symbols:
1. **Tau2-bench Telecom:** Cyan line with circle markers.
2. **Tau2-bench Retail:** Yellow-green line with diamond markers.
3. **Tau-bench Retail:** Green line with square markers.
4. **Tau2-bench Airline:** Pink line with diamond markers.
5. **Tau-bench Airline:** Blue line with circle markers.
6. **ComplexFuncBench:** Purple line with triangle markers.
### Detailed Analysis
**Data Series Trends and Approximate Points:**
1. **Tau2-bench Telecom (Cyan, Circles):**
* **Trend:** Shows a strong, consistent upward trend from left to right.
* **Data Points (Approximate):** Model 4: ~22%, Model 5: ~23%, Model 10: ~36%, Model 12: ~49%, Model 14: ~58%, Model 16: ~58%, Model 21: ~97%.
2. **Tau2-bench Retail (Yellow-green, Diamonds):**
* **Trend:** Shows a steady, gradual upward trend.
* **Data Points (Approximate):** Model 5: ~63%, Model 8: ~68%, Model 12: ~74%, Model 16: ~80%, Model 21: ~81%.
3. **Tau-bench Retail (Green, Squares):**
* **Trend:** Highly volatile with significant peaks and troughs.
* **Data Points (Approximate):** Model 4: ~44%, Model 5: ~60%, Model 8: ~71%, Model 10: ~23% (sharp drop), Model 11: ~65%, Model 12: ~74% (peak), Model 13: ~68%, Model 14: ~58%, Model 15: ~72%, Model 16: ~74%, Model 18: ~68%.
4. **Tau2-bench Airline (Pink, Diamonds):**
* **Trend:** Shows a moderate, generally upward trend with a slight dip near the end.
* **Data Points (Approximate):** Model 5: ~45%, Model 8: ~50%, Model 12: ~56%, Model 14: ~61%, Model 16: ~64%, Model 18: ~62%.
5. **Tau-bench Airline (Blue, Circles):**
* **Trend:** Shows moderate improvement with some fluctuation.
* **Data Points (Approximate):** Model 4: ~22%, Model 5: ~42%, Model 8: ~50%, Model 10: ~14% (sharp drop), Model 12: ~49%, Model 13: ~50%, Model 14: ~32%, Model 15: ~49%, Model 16: ~52%, Model 18: ~49%.
6. **ComplexFuncBench (Purple, Triangles):**
* **Trend:** Extremely volatile, with the highest peak and the lowest trough on the chart.
* **Data Points (Approximate):** Model 4: ~38%, Model 5: ~66% (peak), Model 8: ~47%, Model 10: ~5% (lowest point), Model 11: ~49%, Model 12: ~65%, Model 13: ~62%, Model 14: ~18%.
### Key Observations
* **Model 10 Anomaly:** Model 10 shows a severe performance drop across three benchmarks: Tau-bench Retail, Tau-bench Airline, and most dramatically, ComplexFuncBench (which hits its minimum). This suggests a potential issue or regression specific to that model version for these tasks.
* **Diverging Performance:** The benchmarks show divergent trends. Tau2-bench Telecom and Tau2-bench Retail show clear, monotonic improvement. In contrast, Tau-bench Retail and ComplexFuncBench are highly unstable.
* **Late-Model Dominance:** By the highest model numbers (21-22), Tau2-bench Telecom achieves the highest score on the chart (~97%), significantly outperforming all other benchmarks at that point.
* **Benchmark Difficulty:** ComplexFuncBench appears to be the most challenging or volatile benchmark, with scores ranging from ~5% to ~66%. Tau2-bench Telecom shows the most consistent learning curve.
### Interpretation
This chart likely compares the progression of different AI model versions (1-22) on specialized task benchmarks. The data suggests that:
1. **Task-Specific Learning:** Models are improving consistently on certain structured tasks (Telecom, Retail via Tau2-bench), indicating successful incremental learning or architecture improvements for those domains.
2. **Instability in Complex Tasks:** The high volatility in ComplexFuncBench and the sharp drops in Tau-bench Retail/Airline at Model 10 suggest that performance on more complex or differently structured tasks is not stable across model updates. A change that improved one task may have harmed another.
3. **Benchmark Evolution:** The "Tau2-bench" variants generally show smoother, more positive trends than their "Tau-bench" counterparts for the same domain (Retail, Airline). This could imply that the Tau2-bench evaluation methodology is more aligned with the models' incremental improvements, or that the models are specifically optimized for it.
4. **The "Model 10" Event:** The synchronized drop at Model 10 is a critical anomaly. It points to a specific model update that was detrimental to a subset of capabilities, highlighting the challenge of balanced, multi-task improvement in model development.
In essence, the chart reveals a narrative of uneven progress: mastery in some areas, instability in others, and the inherent difficulty of advancing performance across a diverse set of cognitive tasks simultaneously.