## Scatter Plot: Music Genre Distribution Across Valid and Test Sets
### Overview
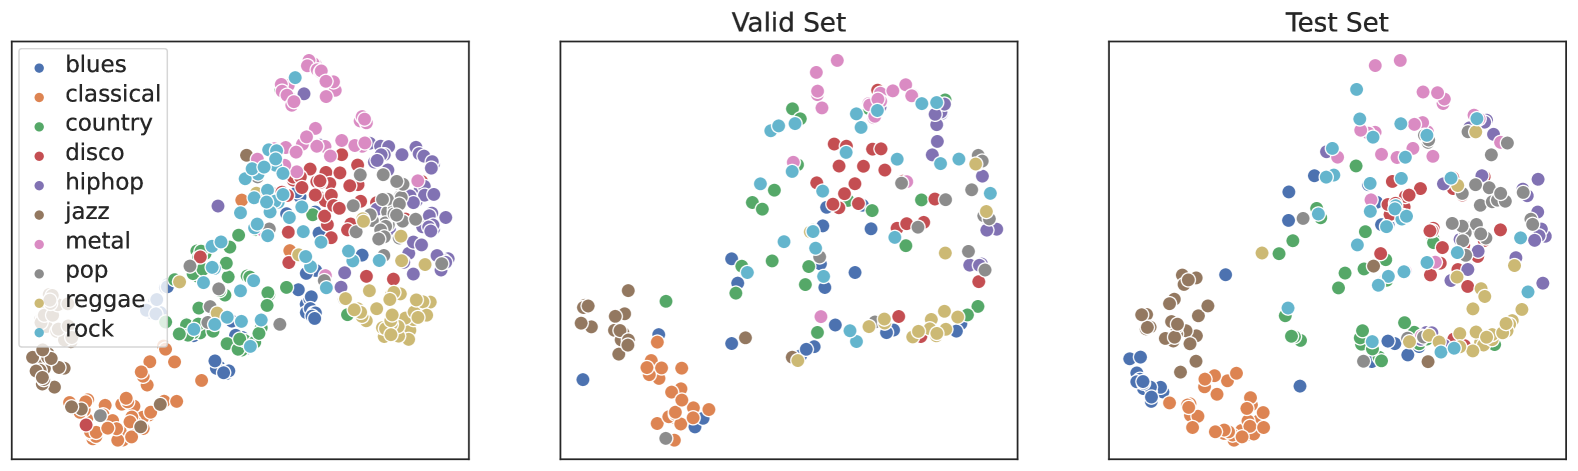
The image contains three scatter plots arranged horizontally, each representing a dataset ("Valid Set" and "Test Set") with colored dots corresponding to 10 music genres. A shared legend on the left maps colors to genres. The plots lack explicit axis labels, but spatial distributions suggest categorical or normalized axes.
### Components/Axes
- **Legend**:
- **Colors**:
- Blues (blue), Classical (orange), Country (green), Disco (red), Hip-Hop (purple), Jazz (brown), Metal (pink), Pop (gray), Reggae (yellow), Rock (dark blue).
- **Position**: Left-aligned, outside all plots.
- **Plots**:
- **Left Plot**: Unlabeled, likely the full dataset.
- **Middle Plot**: Labeled "Valid Set."
- **Right Plot**: Labeled "Test Set."
### Detailed Analysis
#### Left Plot (Full Dataset)
- **Genre Clustering**:
- **Blues** and **Classical** dominate the bottom-left quadrant.
- **Metal** and **Pop** cluster in the top-right.
- **Jazz** and **Reggae** occupy the bottom-center.
- **Disco**, **Hip-Hop**, and **Rock** are dispersed across the middle.
- **Overlap**: High density of overlapping dots in central regions.
#### Middle Plot (Valid Set)
- **Genre Clustering**:
- **Blues** and **Classical** remain in the bottom-left but with reduced density.
- **Metal** and **Pop** spread toward the top-right but with less overlap.
- **Jazz** and **Reggae** shift slightly rightward.
- **Disco**, **Hip-Hop**, and **Rock** show moderate dispersion.
- **Overlap**: Reduced compared to the left plot, with clearer separation between genres.
#### Right Plot (Test Set)
- **Genre Clustering**:
- **Blues** and **Classical** are tightly packed in the bottom-left, forming distinct clusters.
- **Metal** and **Pop** occupy the top-right but with minimal overlap.
- **Jazz** and **Reggae** are isolated in the bottom-center.
- **Disco**, **Hip-Hop**, and **Rock** are scattered but less intermixed.
- **Overlap**: Minimal, with sharp boundaries between genres.
### Key Observations
1. **Consistency**: Blues and Classical consistently occupy the bottom-left across all plots, suggesting they are foundational or share similar features.
2. **Validation vs. Testing**:
- The Valid Set shows moderate genre separation, while the Test Set exhibits near-perfect clustering, implying the model generalizes better on unseen data.
3. **Anomalies**:
- **Disco** and **Hip-Hop** appear more dispersed in the Test Set, potentially indicating underrepresentation or unique characteristics.
4. **Axis Interpretation**:
- Unlabeled axes likely represent normalized features (e.g., tempo, instrumentation) or categorical dimensions (e.g., era, region).
### Interpretation
The Test Set’s sharp genre separation suggests the model effectively distinguishes between categories in unseen data, while the Valid Set’s moderate overlap may reflect training-phase ambiguity. Blues and Classical’s consistent placement implies they are structurally distinct or foundational to the dataset. The absence of axis labels limits quantitative analysis but highlights spatial relationships critical for understanding model performance.