## Chart: Accuracy vs. Model Size
### Overview
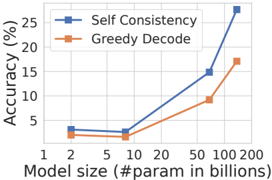
The image is a line chart comparing the accuracy of "Self Consistency" and "Greedy Decode" methods across different model sizes. The x-axis represents model size in billions of parameters, and the y-axis represents accuracy in percentage.
### Components/Axes
* **X-axis:** Model size (#param in billions). Values: 1, 2, 5, 10, 20, 50, 100, 200.
* **Y-axis:** Accuracy (%). Values range from 0 to 25, with increments of 5.
* **Legend:** Located at the top-right of the chart.
* Blue line with square marker: "Self Consistency"
* Orange line with square marker: "Greedy Decode"
### Detailed Analysis
* **Self Consistency (Blue Line):**
* Trend: Generally slopes upward, indicating increasing accuracy with larger model sizes.
* Data Points:
* Model size 2: Accuracy ~3%
* Model size 10: Accuracy ~3%
* Model size 50: Accuracy ~15%
* Model size 100: Accuracy ~20%
* Model size 200: Accuracy ~27%
* **Greedy Decode (Orange Line):**
* Trend: Generally slopes upward, indicating increasing accuracy with larger model sizes.
* Data Points:
* Model size 2: Accuracy ~3.5%
* Model size 10: Accuracy ~2%
* Model size 50: Accuracy ~10%
* Model size 100: Accuracy ~17%
### Key Observations
* Both methods show an increase in accuracy as the model size increases.
* "Self Consistency" consistently outperforms "Greedy Decode" across all model sizes.
* The accuracy of "Self Consistency" increases more rapidly than "Greedy Decode" as the model size grows beyond 50 billion parameters.
### Interpretation
The chart demonstrates that increasing model size generally improves the accuracy of both "Self Consistency" and "Greedy Decode" methods. However, "Self Consistency" appears to be more effective at leveraging larger models, resulting in higher accuracy gains compared to "Greedy Decode." This suggests that "Self Consistency" may be a more scalable approach for improving model performance as computational resources allow for larger models. The flattening of the "Greedy Decode" line at larger model sizes could indicate a diminishing return for this method, or that it requires further optimization to fully utilize the increased model capacity.