\n
## Diagram: Neural Architecture Search Process
### Overview
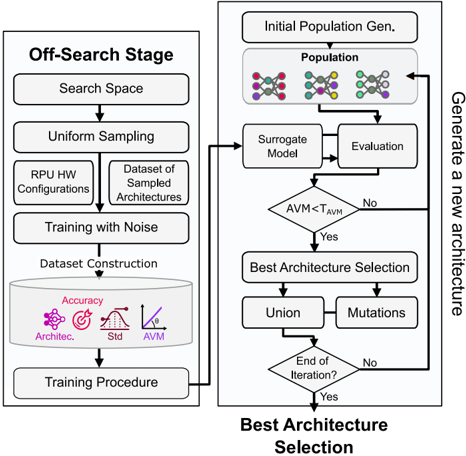
The image depicts a flowchart illustrating a neural architecture search (NAS) process, divided into two main stages: "Off-Search Stage" and "Best Architecture Selection". The diagram outlines the steps involved in generating and evaluating candidate neural network architectures.
### Components/Axes
The diagram is structured as a flowchart with rectangular boxes representing processes and arrows indicating the flow of information. Key components include:
* **Off-Search Stage:** This stage involves defining the search space, uniform sampling of architectures, training with noise, and dataset construction.
* **Best Architecture Selection:** This stage involves initial population generation, surrogate model evaluation, architecture selection, union/mutation operations, and iteration control.
* **Data Representation:** Within the "Dataset Construction" box, there are visual representations of data: "Accuracy" (represented by a circular graph), "Architec." (likely representing architectural complexity), "Std" (standard deviation), and "AVM" (Average Validation Metric).
* **Decision Point:** A diamond-shaped box labeled "AVM < TAVM" represents a decision point based on the comparison of the Average Validation Metric (AVM) with a threshold (TAVM).
* **Iteration Control:** A diamond-shaped box labeled "End of Iteration?" controls the loop within the "Best Architecture Selection" stage.
### Detailed Analysis or Content Details
The process flow is as follows:
1. **Off-Search Stage:**
* Starts with defining the "Search Space".
* Proceeds to "Uniform Sampling" to generate a "Dataset of Sampled Architectures" from "RPU HW Configurations".
* The sampled architectures are then subjected to "Training with Noise".
* This leads to "Dataset Construction" which includes metrics like "Accuracy", "Architec.", "Std", and "AVM".
* Finally, a "Training Procedure" is applied.
2. **Best Architecture Selection:**
* Begins with "Initial Population Gen." creating a "Population" of architectures (represented by colored nodes).
* Each architecture is evaluated using a "Surrogate Model" and "Evaluation" process.
* A decision is made: "AVM < TAVM?".
* If "Yes", the process moves to "Best Architecture Selection".
* If "No", the process returns to the "Surrogate Model" and "Evaluation" step.
* "Best Architecture Selection" involves "Union" and "Mutations" operations.
* The process checks for "End of Iteration?".
* If "Yes", the loop terminates.
* If "No", the process returns to the "Surrogate Model" and "Evaluation" step.
* The entire "Best Architecture Selection" stage is connected to the "Off-Search Stage" via an arrow indicating the generation of a new architecture.
The "Population" in the "Initial Population Gen." stage consists of several colored nodes, each representing a different architecture. The colors appear to be: purple, green, orange, and blue.
### Key Observations
* The diagram highlights an iterative process of architecture search and evaluation.
* The use of a surrogate model suggests an attempt to reduce the computational cost of evaluating each architecture directly.
* The "AVM < TAVM" decision point indicates a threshold-based selection criterion.
* The "Union" and "Mutations" operations suggest a genetic algorithm-inspired approach to architecture evolution.
* The diagram does not provide specific numerical values for AVM, TAVM, or any other metrics.
### Interpretation
The diagram illustrates a common approach to Neural Architecture Search (NAS). The "Off-Search Stage" focuses on efficiently exploring the vast space of possible architectures, while the "Best Architecture Selection" stage refines the search through iterative evaluation and optimization. The use of a surrogate model is a key technique for accelerating the search process. The diagram suggests a closed-loop system where the performance of architectures informs the generation of new candidates. The "AVM" metric likely represents a measure of validation performance, and the "TAVM" threshold determines whether an architecture is considered "good enough" to be selected. The "Union" and "Mutations" operations are typical of evolutionary algorithms, where architectures are combined and modified to create new, potentially better designs. The diagram provides a high-level overview of the NAS process and does not delve into the specific details of the surrogate model, evaluation function, or mutation operators. It is a conceptual representation of the workflow rather than a detailed technical specification.