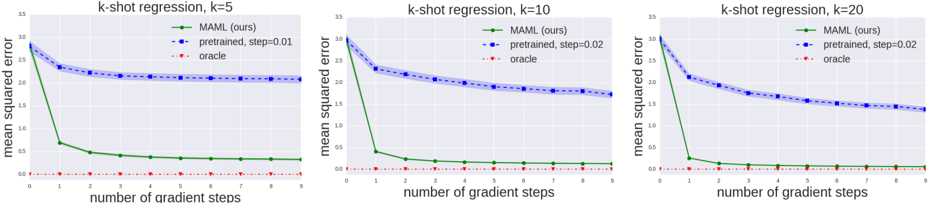
## Chart: K-shot Regression Performance Comparison
### Overview
The image presents three line charts comparing the performance of different regression models (MAML, pretrained, and oracle) across varying numbers of gradient steps (0 to 9). Each chart corresponds to a different value of 'k' in k-shot regression (k=5, k=10, and k=20). The y-axis represents the mean squared error, and the x-axis represents the number of gradient steps.
### Components/Axes
* **Title:** Each chart has a title "k-shot regression, k=[value]", where value is 5, 10, or 20.
* **X-axis:** "number of gradient steps" with ticks at 0, 1, 2, 3, 4, 5, 6, 7, 8, and 9.
* **Y-axis:** "mean squared error" with ticks at 0.0, 0.5, 1.0, 1.5, 2.0, 2.5, 3.0, and 3.5.
* **Legend:** Located in the top-right corner of each chart.
* Green line: "MAML (ours)"
* Blue dashed line with shaded area: "pretrained, step=[value]" where value is 0.01 for k=5 and 0.02 for k=10 and k=20.
* Red dotted line: "oracle"
### Detailed Analysis
**Chart 1: k-shot regression, k=5**
* **MAML (ours) - Green Line:** The green line starts at approximately 2.8 and rapidly decreases to around 0.7 at step 1. It then gradually decreases further, reaching approximately 0.4 at step 9.
* **pretrained, step=0.01 - Blue Dashed Line:** The blue dashed line starts at approximately 2.9 and decreases to around 2.3 at step 1. It then plateaus, fluctuating slightly around 2.1 between steps 2 and 9. The shaded area around the line indicates the uncertainty or variance.
* **oracle - Red Dotted Line:** The red dotted line remains consistently low, close to 0.05, across all gradient steps.
**Chart 2: k-shot regression, k=10**
* **MAML (ours) - Green Line:** The green line starts at approximately 3.0 and rapidly decreases to around 0.4 at step 1. It then gradually decreases further, reaching approximately 0.2 at step 9.
* **pretrained, step=0.02 - Blue Dashed Line:** The blue dashed line starts at approximately 3.0 and decreases to around 2.1 at step 1. It then plateaus, fluctuating slightly around 1.8 between steps 2 and 9. The shaded area around the line indicates the uncertainty or variance.
* **oracle - Red Dotted Line:** The red dotted line remains consistently low, close to 0.1, across all gradient steps.
**Chart 3: k-shot regression, k=20**
* **MAML (ours) - Green Line:** The green line starts at approximately 3.0 and rapidly decreases to around 0.3 at step 1. It then gradually decreases further, reaching approximately 0.15 at step 9.
* **pretrained, step=0.02 - Blue Dashed Line:** The blue dashed line starts at approximately 3.0 and decreases to around 2.1 at step 1. It then plateaus, fluctuating slightly around 1.5 between steps 2 and 9. The shaded area around the line indicates the uncertainty or variance.
* **oracle - Red Dotted Line:** The red dotted line remains consistently low, close to 0.1, across all gradient steps.
### Key Observations
* The MAML model (green line) consistently shows a rapid decrease in mean squared error within the first few gradient steps across all values of k.
* The pretrained model (blue dashed line) shows a slower decrease in error and plateaus after the first few steps. The shaded region indicates variance in the pretrained model's performance.
* The oracle model (red dotted line) consistently achieves the lowest mean squared error across all gradient steps and values of k.
* As the value of k increases (from 5 to 20), the MAML model's performance improves, achieving lower mean squared errors. The pretrained model also shows some improvement with increasing k.
### Interpretation
The charts demonstrate the performance of MAML, pretrained, and oracle regression models under different k-shot learning scenarios. The MAML model exhibits rapid learning, quickly reducing the mean squared error with a few gradient steps. The pretrained model shows a more gradual learning curve and plateaus at a higher error level compared to MAML. The oracle model represents the ideal performance, achieving the lowest possible error.
The increase in 'k' (number of shots) improves the performance of both MAML and the pretrained model, suggesting that more data points per task lead to better generalization and lower error. The MAML model consistently outperforms the pretrained model, indicating its effectiveness in few-shot learning scenarios. The oracle model serves as a benchmark, highlighting the potential for further improvement in the other models.