## Chart Type: Line Graphs Comparing Model Performance
### Overview
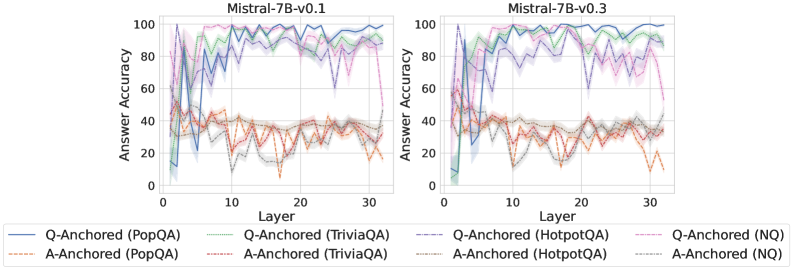
The image presents two line graphs side-by-side, comparing the performance of two versions of the Mistral-7B model (v0.1 and v0.3) on various question-answering tasks. The graphs depict the "Answer Accuracy" as a function of "Layer" for different question-answering datasets and anchoring methods (Q-Anchored and A-Anchored).
### Components/Axes
* **Titles:**
* Left Graph: "Mistral-7B-v0.1"
* Right Graph: "Mistral-7B-v0.3"
* **Y-Axis:** "Answer Accuracy" ranging from 0 to 100. Increments of 20.
* **X-Axis:** "Layer" ranging from 0 to 30. Increments of 10.
* **Legend:** Located at the bottom of the image, describing the lines:
* Blue: "Q-Anchored (PopQA)"
* Brown Dashed: "A-Anchored (PopQA)"
* Green: "Q-Anchored (TriviaQA)"
* Orange Dashed: "A-Anchored (TriviaQA)"
* Red: "Q-Anchored (HotpotQA)"
* Gray Dashed: "A-Anchored (HotpotQA)"
* Pink Dashed-dotted: "Q-Anchored (NQ)"
* Black Dotted: "A-Anchored (NQ)"
### Detailed Analysis
**Left Graph (Mistral-7B-v0.1):**
* **Q-Anchored (PopQA) (Blue):** Starts around 10% accuracy at layer 0, rapidly increases to approximately 80% by layer 5, and then fluctuates between 80% and 95% for the remaining layers.
* **A-Anchored (PopQA) (Brown Dashed):** Starts around 40% accuracy at layer 0, fluctuates between 30% and 50% across all layers.
* **Q-Anchored (TriviaQA) (Green):** Starts around 50% accuracy at layer 0, rapidly increases to approximately 90% by layer 5, and then fluctuates between 85% and 100% for the remaining layers.
* **A-Anchored (TriviaQA) (Orange Dashed):** Starts around 40% accuracy at layer 0, fluctuates between 20% and 45% across all layers.
* **Q-Anchored (HotpotQA) (Red):** Starts around 40% accuracy at layer 0, fluctuates between 20% and 50% across all layers.
* **A-Anchored (HotpotQA) (Gray Dashed):** Starts around 40% accuracy at layer 0, fluctuates between 20% and 45% across all layers.
* **Q-Anchored (NQ) (Pink Dashed-dotted):** Starts around 50% accuracy at layer 0, rapidly increases to approximately 80% by layer 5, and then fluctuates between 80% and 95% for the remaining layers.
* **A-Anchored (NQ) (Black Dotted):** Starts around 40% accuracy at layer 0, fluctuates between 20% and 45% across all layers.
**Right Graph (Mistral-7B-v0.3):**
* **Q-Anchored (PopQA) (Blue):** Starts around 10% accuracy at layer 0, rapidly increases to approximately 80% by layer 5, and then fluctuates between 80% and 95% for the remaining layers.
* **A-Anchored (PopQA) (Brown Dashed):** Starts around 40% accuracy at layer 0, fluctuates between 30% and 50% across all layers.
* **Q-Anchored (TriviaQA) (Green):** Starts around 50% accuracy at layer 0, rapidly increases to approximately 90% by layer 5, and then fluctuates between 85% and 100% for the remaining layers.
* **A-Anchored (TriviaQA) (Orange Dashed):** Starts around 40% accuracy at layer 0, fluctuates between 20% and 45% across all layers.
* **Q-Anchored (HotpotQA) (Red):** Starts around 40% accuracy at layer 0, fluctuates between 20% and 50% across all layers.
* **A-Anchored (HotpotQA) (Gray Dashed):** Starts around 40% accuracy at layer 0, fluctuates between 20% and 45% across all layers.
* **Q-Anchored (NQ) (Pink Dashed-dotted):** Starts around 50% accuracy at layer 0, rapidly increases to approximately 80% by layer 5, and then fluctuates between 80% and 95% for the remaining layers.
* **A-Anchored (NQ) (Black Dotted):** Starts around 40% accuracy at layer 0, fluctuates between 20% and 45% across all layers.
### Key Observations
* **Q-Anchored vs. A-Anchored:** Q-Anchored methods (PopQA, TriviaQA, NQ) generally achieve significantly higher answer accuracy compared to A-Anchored methods across both model versions.
* **Dataset Performance:** PopQA, TriviaQA, and NQ datasets show higher accuracy with Q-Anchoring, while HotpotQA consistently shows lower accuracy for both anchoring methods.
* **Model Version Comparison:** The performance between Mistral-7B-v0.1 and Mistral-7B-v0.3 appears very similar across all datasets and anchoring methods.
* **Layer Dependence:** The accuracy of Q-Anchored methods tends to increase rapidly in the initial layers (0-5) and then stabilizes, suggesting that these layers are crucial for learning.
### Interpretation
The data suggests that Q-Anchoring is a more effective method for question-answering tasks with the Mistral-7B model, particularly for the PopQA, TriviaQA, and NQ datasets. The lower performance of HotpotQA indicates that this dataset may pose a greater challenge for the model. The similarity in performance between the two model versions (v0.1 and v0.3) suggests that the changes between these versions did not significantly impact the answer accuracy on these specific tasks. The rapid increase in accuracy in the initial layers highlights the importance of these layers in the model's learning process. The shaded regions around the lines likely represent the standard deviation or confidence intervals, indicating the variability in performance across different runs or samples.