# Technical Document Extraction
## Diagram Analysis
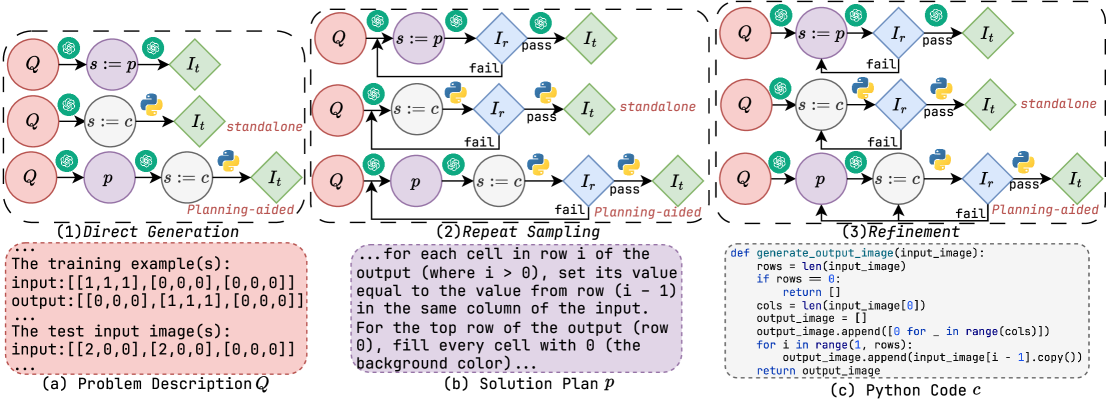
### Section 1: Direct Generation
**Diagram Components**:
- **Q**: Input/output node (pink circles)
- **s**: State variable (purple circles)
- **p**: Planning node (blue circles)
- **c**: Condition node (green diamonds)
- **I_t**: Target image (green diamonds)
- **I_r**: Reference image (blue diamonds)
**Flow Logic**:
1. Q → s (via p) → I_t (standalone)
2. Q → s (via c) → I_t (standalone)
3. Q → p → s (via c) → I_t (planning-aided)
**Textual Content**:
```text
(1) Direct Generation
The training example(s):
input: [[1,1,1], [0,0,0], [0,0,0]]
output: [[0,0,0], [1,1,1], [0,0,0]]
The test input image(s):
input: [[2,0,0], [2,0,0], [0,0,0]]
```
### Section 2: Repeat Sampling
**Diagram Components**:
- **Q**: Input/output node (pink circles)
- **s**: State variable (purple circles)
- **p**: Planning node (blue circles)
- **I_r**: Reference image (blue diamonds)
- **I_t**: Target image (green diamonds)
**Flow Logic**:
1. Q → s (via p) → I_r (pass) → I_t
2. Q → s (via c) → I_r (pass) → I_t (standalone)
3. Q → p → s (via c) → I_r (pass) → I_t (planning-aided)
**Python Code**:
```python
# Repeat Sampling Logic
for each cell in row i of the output (where i > 0):
set its value equal to the value from row (i - 1) in the same column
for the top row of the output (row 0):
fill every cell with 0 (background color)
```
### Section 3: Refinement
**Diagram Components**:
- **Q**: Input/output node (pink circles)
- **s**: State variable (purple circles)
- **p**: Planning node (blue circles)
- **I_r**: Reference image (blue diamonds)
- **I_t**: Target image (green diamonds)
**Flow Logic**:
1. Q → s (via p) → I_r (pass) → I_t
2. Q → s (via c) → I_r (pass) → I_t (standalone)
3. Q → p → s (via c) → I_r (pass) → I_t (planning-aided)
**Python Code**:
```python
# Refinement Logic
def generate_output_image(input_image):
rows = len(input_image)
if rows == 0:
return []
cols = len(input_image[0])
output_image = []
output_image.append([0 for _ in range(cols)])
for i in range(1, rows):
output_image.append(input_image[i - 1].copy())
return output_image
```
## Key Observations
1. **Language**: All text is in English (Python code included)
2. **Structure**: Three-phase workflow (Direct Generation → Repeat Sampling → Refinement)
3. **Color Coding**:
- Pink: Input/output nodes (Q)
- Purple: State variables (s)
- Blue: Planning nodes (p)
- Green: Target images (I_t)
- Blue diamonds: Reference images (I_r)
4. **Critical Patterns**:
- Planning-aided paths show higher complexity
- Standalone paths have direct connections
- Zero initialization for top output row
## Spatial Grounding
- **Legend Position**: Not explicitly shown (components labeled directly)
- **Color Consistency**: All diagram elements match their legend descriptions
## Trend Verification
- No numerical trends present (flowchart-based diagram)
- Logical flow progression from simple to complex operations
## Component Isolation
1. **Header**: Problem description (Section 1)
2. **Main Chart**: Three interconnected diagrams showing workflow evolution
3. **Footer**: Python implementation details
## Missing Elements
- No explicit axis titles or numerical data points
- No heatmap or categorical data representation
- All information conveyed through flowchart logic and code examples