## Diagram: Comparison of Optimal Path vs. Model Path
### Overview
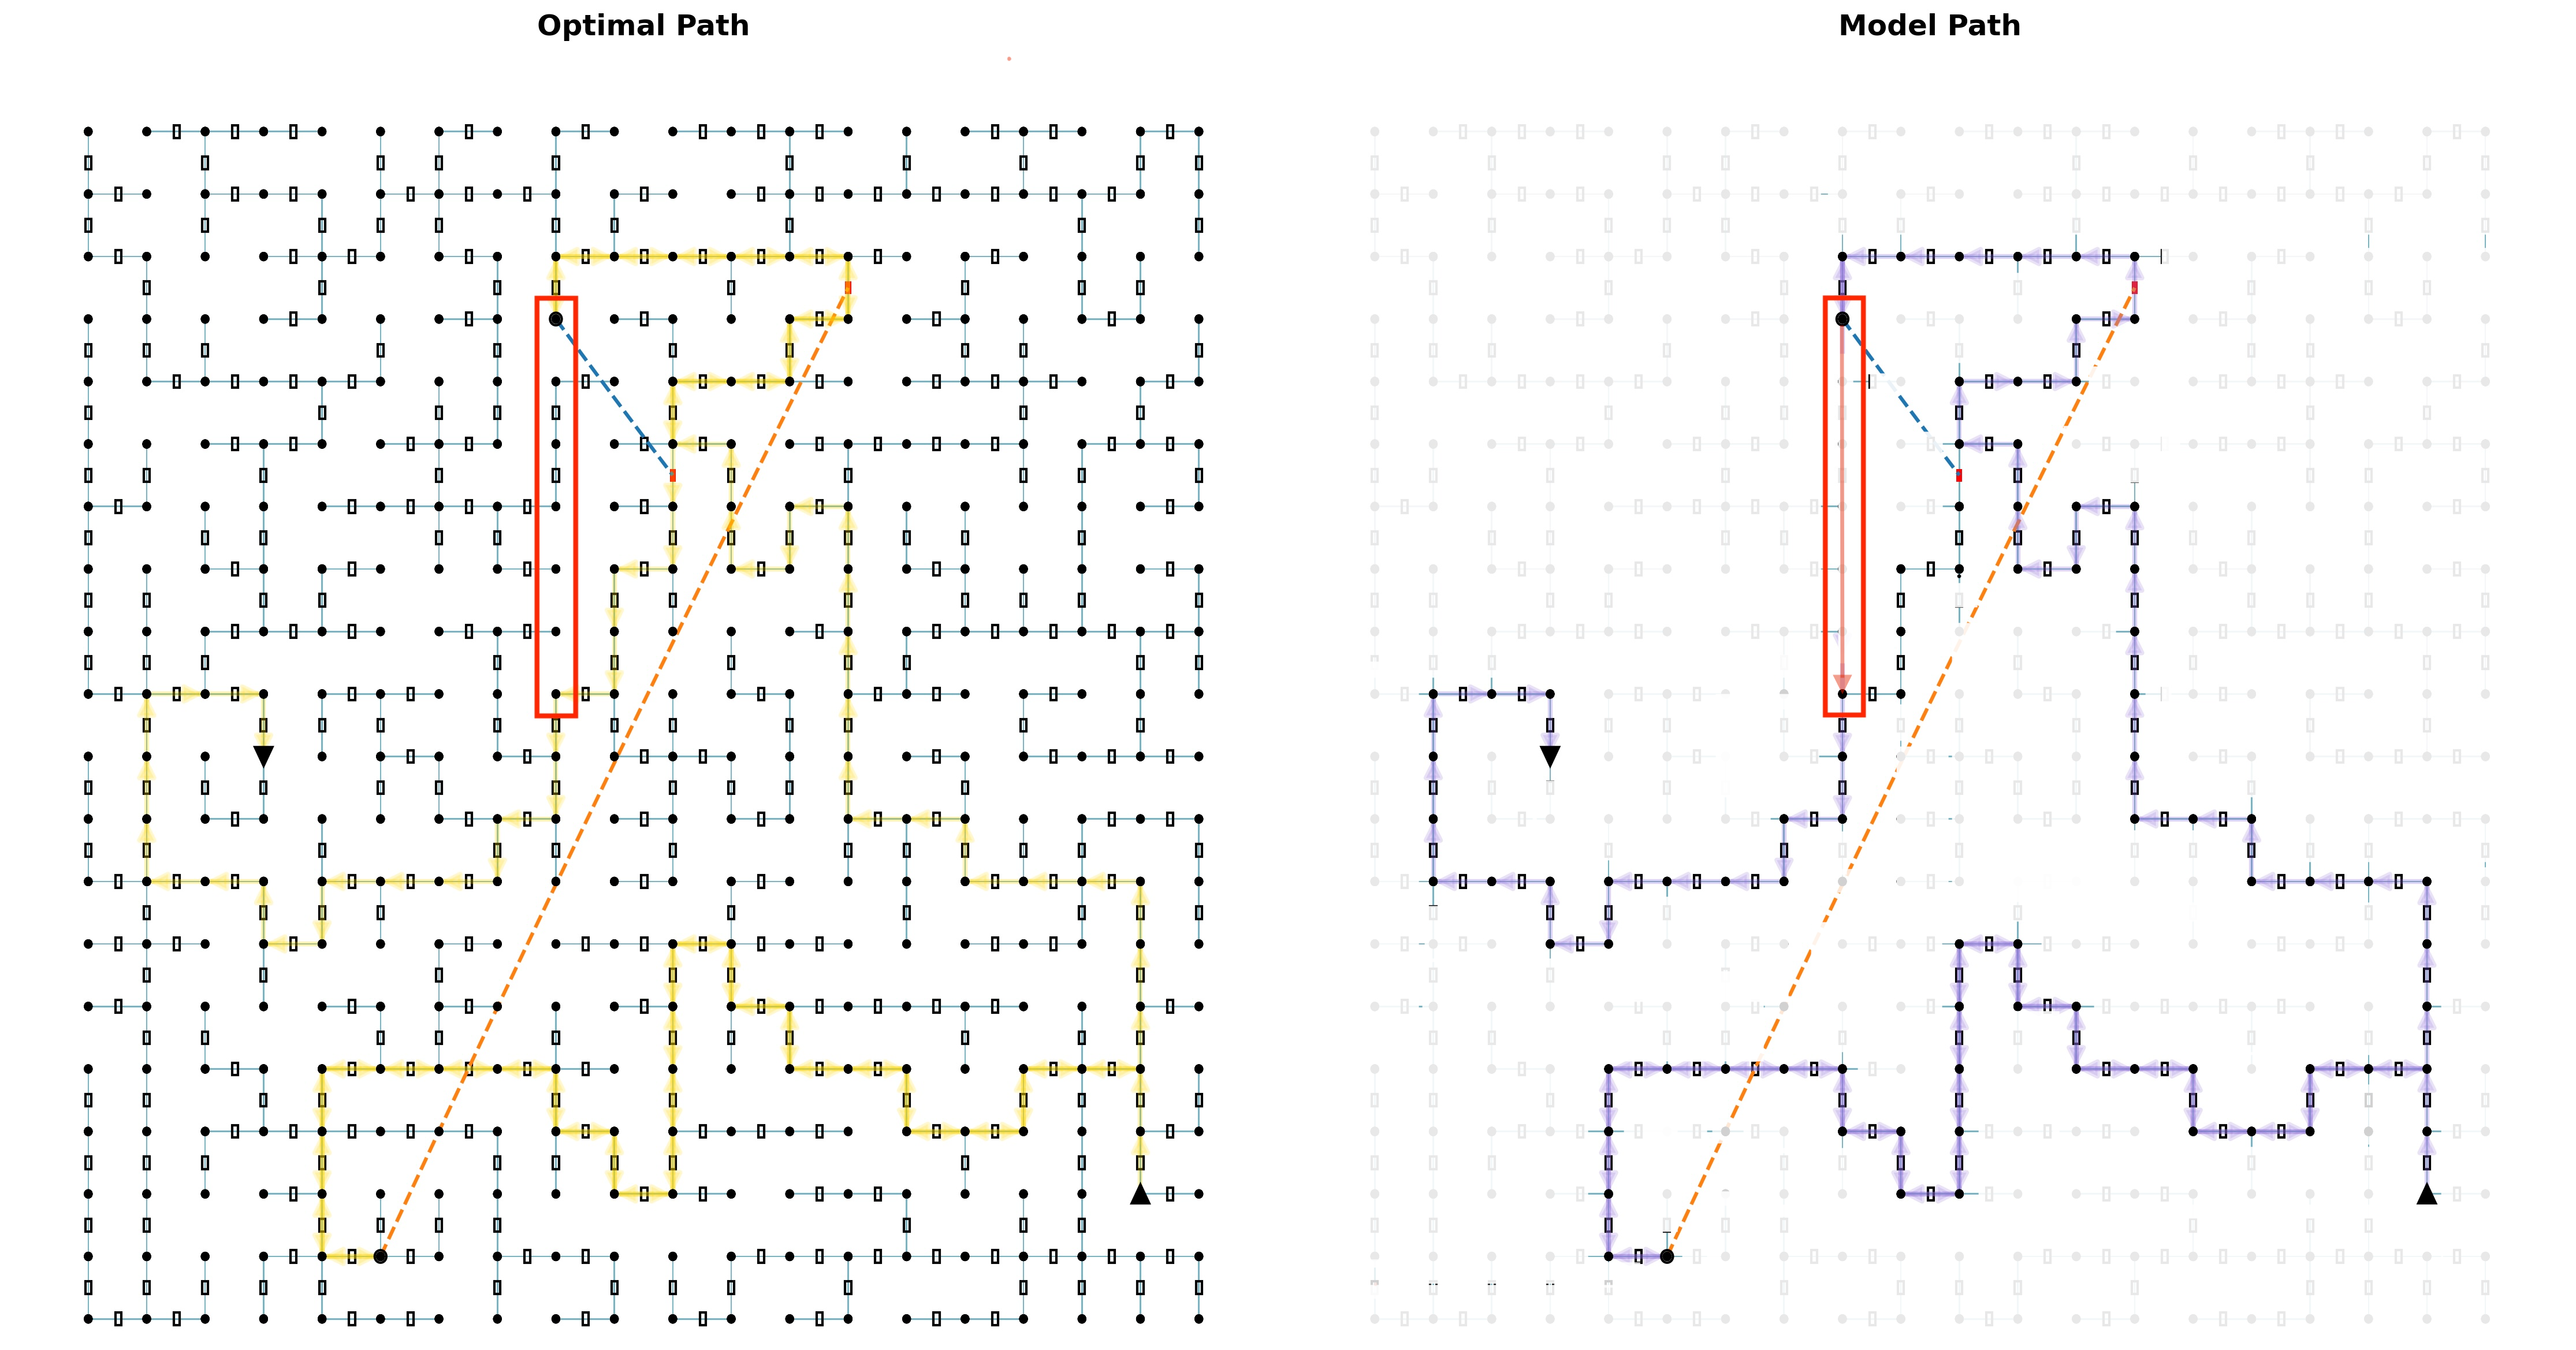
The image presents two side-by-side grid-based network diagrams, each visualizing a pathfinding solution. The left diagram is labeled "Optimal Path" and highlights a route in yellow. The right diagram is labeled "Model Path" and highlights a route in purple. Both diagrams share an identical underlying grid structure, a dashed orange diagonal reference line, and a red-boxed vertical segment.
### Components/Axes
* **Grid Structure:** A uniform lattice of black nodes (dots) connected by thin lines (edges). Some edges contain small rectangular markers, likely representing obstacles or gates.
* **Labels:**
* "Optimal Path" (Top-center of the left grid).
* "Model Path" (Top-center of the right grid).
* **Markers:**
* **Black Circle:** Located in the bottom-left quadrant of both grids; serves as the starting point.
* **Black Triangle:** Located in the bottom-right corner of both grids; serves as the destination point.
* **Red Rectangle:** Positioned in the upper-middle section of both grids, highlighting a specific vertical path segment.
* **Dashed Orange Line:** A diagonal line extending from the bottom-left (near the black circle) to the top-right of the grid.
* **Path Indicators:**
* **Yellow Path (Left):** A highlighted route connecting the start and end points.
* **Purple Path (Right):** A highlighted route connecting the start and end points, featuring directional arrows on the segments.
### Detailed Analysis
#### Left Grid: Optimal Path
* **Trend:** The path follows a relatively direct trajectory from the bottom-left start point toward the top-right, then descends toward the bottom-right destination.
* **Pathing:** The path originates at the black circle, moves right and upward, enters the red-boxed region from the top, traverses it vertically downward, and then exits the box to navigate toward the bottom-right black triangle. The yellow highlighting is continuous.
#### Right Grid: Model Path
* **Trend:** The path is significantly more complex and winding compared to the Optimal Path. It exhibits "suboptimal" behavior, characterized by frequent turns and backtracking.
* **Pathing:** The path originates at the black circle, moves in a complex, jagged pattern through the left and bottom sections of the grid. Like the Optimal Path, it enters the red-boxed region from the top and traverses it vertically downward. After exiting the red box, it continues to navigate a winding route through the bottom-right quadrant before reaching the black triangle.
* **Directionality:** Unlike the Optimal Path, the purple path includes explicit directional arrows on the segments, indicating the flow of movement.
### Key Observations
* **The "Bottleneck" (Red Box):** Both the Optimal and Model paths traverse the exact same vertical segment within the red rectangle. This suggests that this specific segment is a mandatory waypoint or a constrained passage that both the optimal algorithm and the model successfully identified.
* **Path Efficiency:** The "Model Path" (purple) is visibly longer and more convoluted than the "Optimal Path" (yellow). The model appears to struggle with efficient navigation in the open grid areas, whereas the optimal path is much straighter.
* **Reference Line:** The dashed orange diagonal line appears to act as a Euclidean distance reference or a heuristic constraint. The Optimal Path stays closer to this line in its general trajectory, whereas the Model Path deviates significantly.
### Interpretation
This image is a visualization of a pathfinding algorithm's performance, likely from a Reinforcement Learning (RL) or path-planning context.
* **What the data demonstrates:** The "Optimal Path" represents the ground truth or the most efficient solution (shortest path). The "Model Path" represents the output of an AI agent or algorithm that has not yet fully converged or learned the optimal policy.
* **Why it matters:** The discrepancy between the two paths highlights the "suboptimality" of the model. While the model has learned to navigate the critical "bottleneck" (the red box), it lacks the efficiency to navigate the rest of the grid optimally, resulting in unnecessary, winding movements.
* **Peircean Investigative Reading:** The presence of the red box suggests that the model is capable of learning specific constraints or high-value waypoints, but the surrounding "noise" in the purple path indicates that the model's exploration or exploitation strategy is currently inefficient. The model is "getting there," but it is taking a much longer route than necessary.