## Chart Type: Comparative Histograms and Bar Charts
### Overview
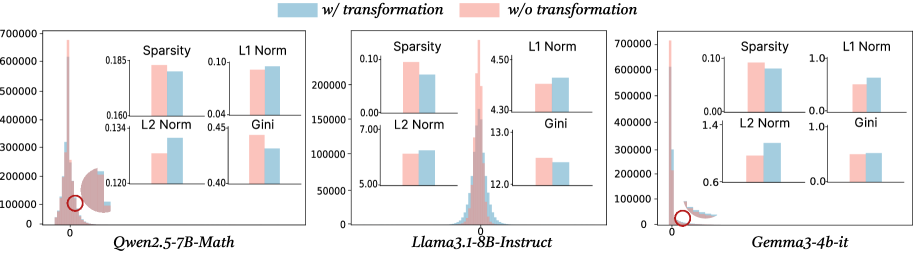
The image presents a comparative analysis of three different language models: *Qwen2.5-7B-Math*, *Llama3.1-8B-Instruct*, and *Gemma3-4b-it*. For each model, a histogram shows the distribution of some unspecified values (likely weights or activations), and a set of bar charts compares the model's characteristics with and without a certain transformation. The legend at the top indicates that the blue bars/histogram represent "w/ transformation" and the pink bars/histogram represent "w/o transformation".
### Components/Axes
**Overall Structure:** The image is divided into three sections, one for each language model. Each section contains a main histogram and four smaller bar charts.
**Histograms:**
* **Y-axis (Histograms):** The y-axis label is not explicitly provided, but based on the scale (0 to 700000), it likely represents the frequency or count of values within each bin of the histogram.
* **X-axis (Histograms):** The x-axis label is not explicitly provided, but it represents the range of values being distributed. The x-axis ranges from approximately -0.1 to 0.1.
* **Histogram Colors:** Blue represents "w/ transformation", and pink represents "w/o transformation".
**Bar Charts:**
Each model has four bar charts comparing "w/ transformation" (blue) and "w/o transformation" (pink) for the following metrics:
* Sparsity
* L1 Norm
* L2 Norm
* Gini
**Legends:**
* The legend is located at the top of the image.
* "w/ transformation" is represented by the color blue.
* "w/o transformation" is represented by the color pink.
**Model Names (X-axis labels):**
* *Qwen2.5-7B-Math* (left)
* *Llama3.1-8B-Instruct* (center)
* *Gemma3-4b-it* (right)
### Detailed Analysis
**1. Qwen2.5-7B-Math (Left)**
* **Histogram:** The histogram shows a distribution centered around 0. The "w/o transformation" (pink) distribution appears to have a higher peak near 0 compared to the "w/ transformation" (blue) distribution.
* **Sparsity:**
* w/ transformation (blue): ~0.09
* w/o transformation (pink): ~0.18
* **L1 Norm:**
* w/ transformation (blue): ~0.09
* w/o transformation (pink): ~0.10
* **L2 Norm:**
* w/ transformation (blue): ~0.15
* w/o transformation (pink): ~0.13
* **Gini:**
* w/ transformation (blue): ~0.44
* w/o transformation (pink): ~0.41
**2. Llama3.1-8B-Instruct (Center)**
* **Histogram:** Similar to Qwen, the histogram is centered around 0. The "w/o transformation" (pink) distribution has a higher peak.
* **Sparsity:**
* w/ transformation (blue): ~0.09
* w/o transformation (pink): ~0.10
* **L1 Norm:**
* w/ transformation (blue): ~4.4
* w/o transformation (pink): ~4.3
* **L2 Norm:**
* w/ transformation (blue): ~6.0
* w/o transformation (pink): ~7.0
* **Gini:**
* w/ transformation (blue): ~12.3
* w/o transformation (pink): ~12.8
**3. Gemma3-4b-it (Right)**
* **Histogram:** Again, centered around 0, with a higher peak for "w/o transformation" (pink).
* **Sparsity:**
* w/ transformation (blue): ~0.09
* w/o transformation (pink): ~0.10
* **L1 Norm:**
* w/ transformation (blue): ~0.9
* w/o transformation (pink): ~0.8
* **L2 Norm:**
* w/ transformation (blue): ~1.0
* w/o transformation (pink): ~0.7
* **Gini:**
* w/ transformation (blue): ~0.9
* w/o transformation (pink): ~0.8
### Key Observations
* **Histograms:** The histograms for all three models show a similar pattern: a distribution centered around zero, with the "w/o transformation" distribution having a higher peak.
* **Sparsity:** In all three models, the sparsity is higher "w/o transformation" (pink) compared to "w/ transformation" (blue).
* **L1 Norm:** The L1 Norm varies across the models, with Llama3.1-8B-Instruct having significantly higher values.
* **L2 Norm:** The L2 Norm also varies across the models.
* **Gini:** The Gini coefficient also varies across the models.
### Interpretation
The image compares the impact of a certain transformation on the distribution and characteristics of three different language models. The histograms suggest that the transformation affects the distribution of values, potentially making it less concentrated around zero. The bar charts indicate that the transformation consistently reduces sparsity across all three models. The impact on L1 Norm, L2 Norm, and Gini coefficient varies depending on the specific model.
The data suggests that the transformation being applied is likely a regularization technique aimed at reducing sparsity and potentially improving generalization performance. The specific effects on the other metrics (L1 Norm, L2 Norm, Gini) may depend on the nature of the transformation and the architecture of the model. The red circles on the histograms highlight a specific region of interest near zero, possibly indicating a critical area affected by the transformation.