## Line Charts: Performance Metrics vs. Shuffle Ratio
### Overview
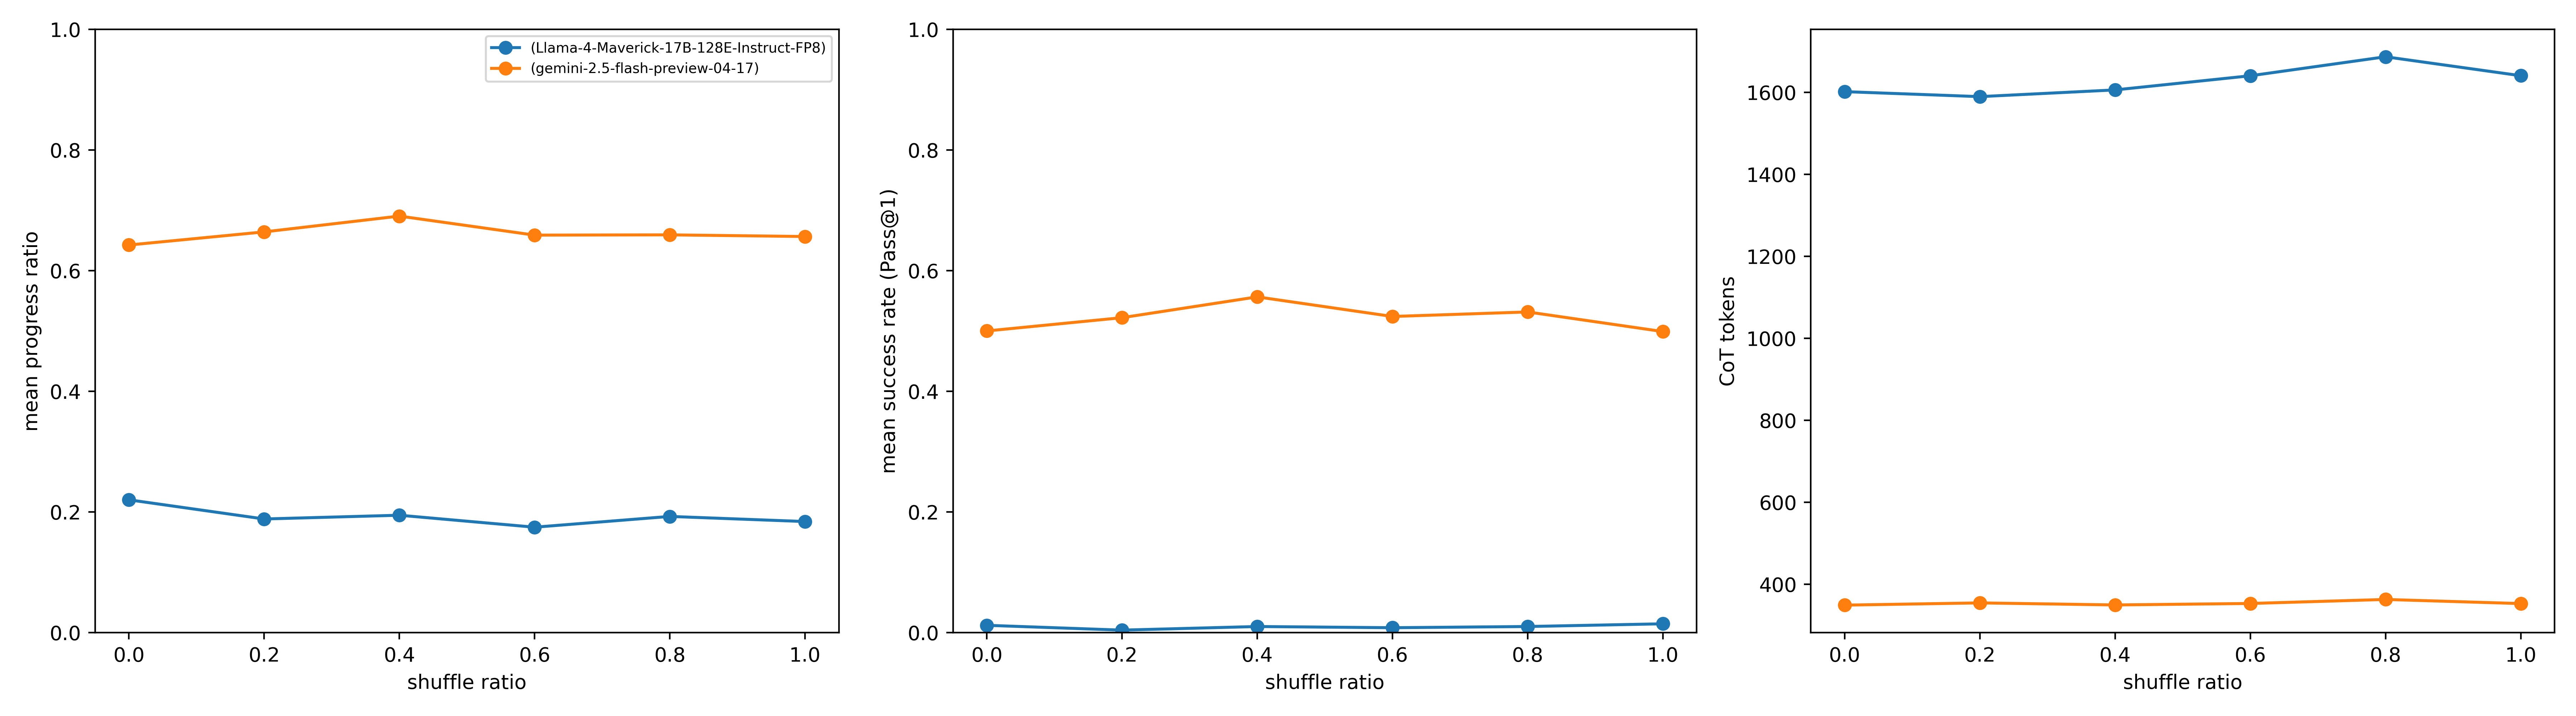
This image displays three side-by-side line charts comparing the performance of two AI models: **Llama-4-Maverick-17B-128E-Instruct-FP8** (represented by the blue line) and **gemini-2.5-flash-preview-04-17** (represented by the orange line). The charts evaluate these models across a "shuffle ratio" ranging from 0.0 to 1.0. The three metrics being measured are "mean progress ratio," "mean success rate (Pass@1)," and "CoT tokens."
### Components/Axes
* **Shared X-Axis:** "shuffle ratio" ranging from 0.0 to 1.0 in increments of 0.2.
* **Legend:** Located in the top-left chart.
* **Blue Line:** Llama-4-Maverick-17B-128E-Instruct-FP8
* **Orange Line:** gemini-2.5-flash-preview-04-17
* **Chart 1 (Left) Y-Axis:** "mean progress ratio" (Scale: 0.0 to 1.0).
* **Chart 2 (Center) Y-Axis:** "mean success rate (Pass@1)" (Scale: 0.0 to 1.0).
* **Chart 3 (Right) Y-Axis:** "CoT tokens" (Scale: 400 to 1600).
---
### Detailed Analysis
#### Chart 1: Mean Progress Ratio
* **Blue Line (Llama):** Starts at ~0.22 at 0.0 shuffle ratio. It exhibits a slight downward trend, fluctuating between 0.18 and 0.20 for the remainder of the ratios.
* **Orange Line (Gemini):** Starts at ~0.64 at 0.0 shuffle ratio. It rises to a peak of ~0.69 at 0.4, then stabilizes around 0.66 for the remaining ratios (0.6 to 1.0).
* **Trend:** The Gemini model consistently maintains a significantly higher mean progress ratio than the Llama model.
#### Chart 2: Mean Success Rate (Pass@1)
* **Blue Line (Llama):** Remains consistently near 0.0 across all shuffle ratios, indicating very low success rates for this specific metric.
* **Orange Line (Gemini):** Starts at ~0.50 at 0.0 shuffle ratio. It shows a slight upward trend to ~0.56 at 0.4, then dips back down to ~0.50 at 1.0.
* **Trend:** The Gemini model shows moderate success, while the Llama model shows negligible success on this metric.
#### Chart 3: CoT (Chain of Thought) Tokens
* **Blue Line (Llama):** Starts at ~1600 tokens at 0.0 shuffle ratio. It shows a slight, gradual upward trend, reaching a peak of ~1680 at 0.8, before dipping slightly to ~1640 at 1.0.
* **Orange Line (Gemini):** Starts at ~350 tokens at 0.0 shuffle ratio. It remains extremely stable, hovering consistently between 350 and 360 tokens across all shuffle ratios.
* **Trend:** The Llama model utilizes significantly more CoT tokens (roughly 4.5x more) than the Gemini model.
---
### Key Observations
* **Performance Gap:** Gemini-2.5-flash-preview-04-17 significantly outperforms Llama-4-Maverick-17B-128E-Instruct-FP8 in both "mean progress ratio" and "mean success rate."
* **Efficiency Gap:** There is a massive disparity in "CoT tokens" usage. Llama uses ~1600 tokens per task, whereas Gemini uses ~350. Despite using fewer tokens, Gemini achieves higher success rates.
* **Robustness:** Both models appear robust to the "shuffle ratio." The performance metrics do not fluctuate wildly as the shuffle ratio increases, suggesting that the order of input data has a negligible impact on the reasoning capabilities of either model.
### Interpretation
The data suggests a fundamental difference in the reasoning efficiency and capability between the two models.
1. **Efficiency vs. Verbosity:** The Llama model is generating significantly longer Chain-of-Thought (CoT) sequences (higher token count) but is failing to convert that "thinking" into successful outcomes (low Pass@1). This could indicate that the Llama model is either "hallucinating" or getting lost in its own reasoning process, or that its CoT generation is inherently verbose without adding value.
2. **Model Capability:** Gemini-2.5-flash appears to be a much more efficient and capable model in this specific testing context, achieving higher success rates with a much smaller computational footprint (fewer tokens).
3. **Robustness:** The "shuffle ratio" variable seems to be a test of input sensitivity. The flatness of the lines indicates that both models are invariant to the order of the input, which is a positive trait for general-purpose reasoning models.