\n
## Line Charts: AI Model Performance vs. Shuffle Ratio
### Overview
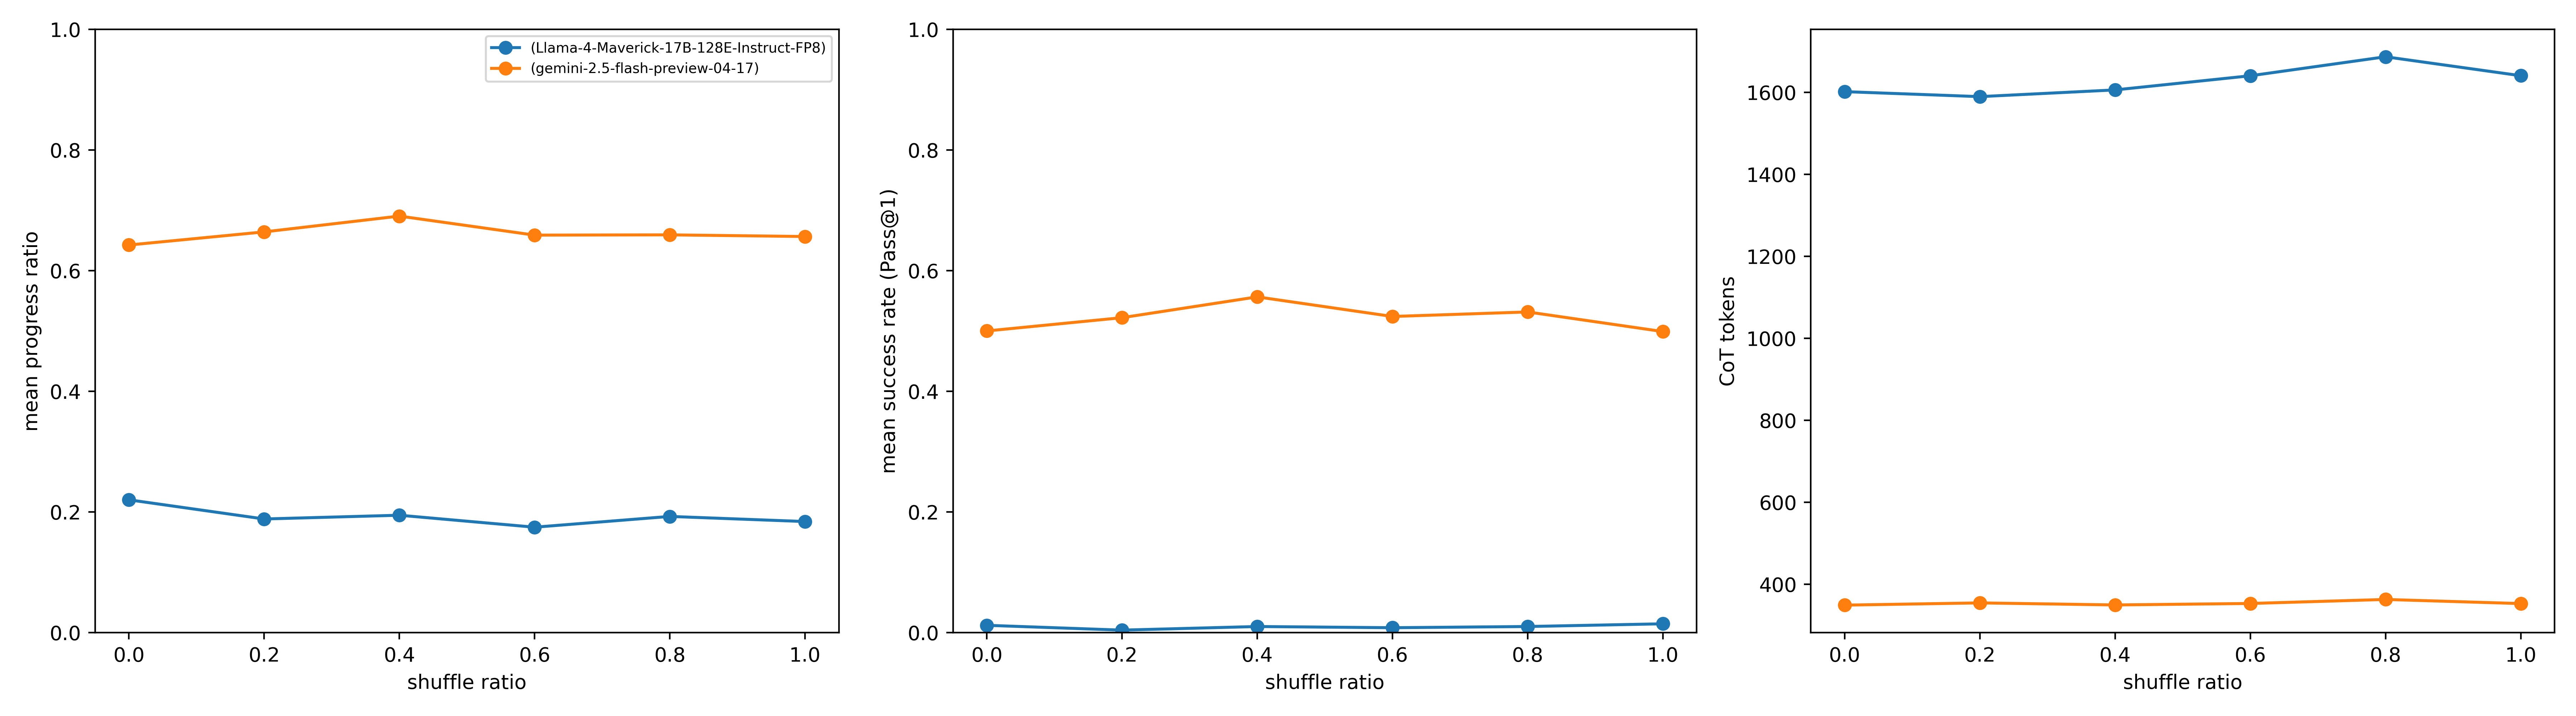
The image displays three horizontally aligned line charts comparing the performance and output characteristics of two AI models across varying "shuffle ratios." The charts share a common x-axis but measure different metrics on their respective y-axes. The models compared are identified in a legend located in the top-left corner of the first chart.
### Components/Axes
* **Legend (Top-Left of First Chart):**
* Blue line with circle markers: `(Llama-4-Maverick-17B-128E-Instruct-FP8)`
* Orange line with circle markers: `(gemini-2.5-flash-preview-04-17)`
* **Common X-Axis (All Charts):**
* Label: `shuffle ratio`
* Scale: Linear, from 0.0 to 1.0, with major ticks at 0.0, 0.2, 0.4, 0.6, 0.8, 1.0.
* **Chart 1 (Left) Y-Axis:**
* Label: `mean progress ratio`
* Scale: Linear, from 0.0 to 1.0, with major ticks at 0.0, 0.2, 0.4, 0.6, 0.8, 1.0.
* **Chart 2 (Center) Y-Axis:**
* Label: `mean success rate (Pass@1)`
* Scale: Linear, from 0.0 to 1.0, with major ticks at 0.0, 0.2, 0.4, 0.6, 0.8, 1.0.
* **Chart 3 (Right) Y-Axis:**
* Label: `CoT tokens`
* Scale: Linear, from 400 to 1600, with major ticks at 400, 600, 800, 1000, 1200, 1400, 1600.
### Detailed Analysis
**Chart 1: Mean Progress Ratio**
* **Trend Verification:** The orange line (gemini) shows a slight upward trend from 0.0 to 0.4, then plateaus. The blue line (Llama) shows a very slight downward trend overall.
* **Data Points (Approximate):**
* **gemini-2.5-flash-preview-04-17 (Orange):** Starts at ~0.64 (0.0), rises to ~0.69 (0.4), then stabilizes around ~0.66 (0.6, 0.8, 1.0).
* **Llama-4-Maverick-17B-128E-Instruct-FP8 (Blue):** Starts at ~0.22 (0.0), dips to ~0.19 (0.2), and remains relatively flat between ~0.18 and ~0.20 for the remaining ratios.
**Chart 2: Mean Success Rate (Pass@1)**
* **Trend Verification:** The orange line (gemini) shows a gentle arc, peaking at 0.4. The blue line (Llama) is consistently near zero with minimal variation.
* **Data Points (Approximate):**
* **gemini-2.5-flash-preview-04-17 (Orange):** Starts at ~0.50 (0.0), peaks at ~0.56 (0.4), and ends at ~0.50 (1.0).
* **Llama-4-Maverick-17B-128E-Instruct-FP8 (Blue):** Remains very close to 0.0 across all shuffle ratios, with values estimated between 0.01 and 0.02.
**Chart 3: CoT Tokens**
* **Trend Verification:** The blue line (Llama) shows a gradual upward trend, peaking at 0.8. The orange line (gemini) is essentially flat.
* **Data Points (Approximate):**
* **Llama-4-Maverick-17B-128E-Instruct-FP8 (Blue):** Starts at ~1600 (0.0), increases to a peak of ~1680 (0.8), and ends at ~1630 (1.0).
* **gemini-2.5-flash-preview-04-17 (Orange):** Remains stable around ~350 tokens across all shuffle ratios.
### Key Observations
1. **Performance Disparity:** The gemini model consistently outperforms the Llama model on both `mean progress ratio` and `mean success rate` metrics by a significant margin.
2. **Output Length Disparity:** The Llama model generates substantially more Chain-of-Thought (CoT) tokens (approx. 4.5x more) than the gemini model, regardless of the shuffle ratio.
3. **Sensitivity to Shuffle Ratio:**
* The gemini model's performance (progress and success) shows a slight optimal point around a shuffle ratio of 0.4.
* The Llama model's metrics are largely insensitive to the shuffle ratio, showing only minor fluctuations.
* The Llama model's CoT token count shows a slight positive correlation with shuffle ratio, peaking at 0.8.
4. **Anomaly:** The Llama model exhibits a very low success rate (~0.01) despite a moderate progress ratio (~0.2). This suggests it may make partial progress on tasks but rarely completes them successfully under the tested conditions.
### Interpretation
This data suggests a fundamental trade-off or difference in operational strategy between the two models. The **gemini-2.5-flash-preview-04-17** model appears to be more efficient and effective for the task being measured: it achieves higher success and progress rates while using far fewer reasoning tokens. Its performance is subtly optimized at a mid-range shuffle ratio (0.4).
In contrast, the **Llama-4-Maverick-17B-128E-Instruct-FP8** model is less successful but more verbose, generating lengthy reasoning chains that do not translate into task completion. Its performance is largely unaffected by the shuffling of input data (as represented by the shuffle ratio), indicating a different, possibly less adaptive, processing mechanism for this specific task. The charts collectively highlight that higher token expenditure does not correlate with better performance in this comparison; in fact, the inverse is observed.