## Scatter Plot: Accuracy vs. Time-to-Answer
### Overview
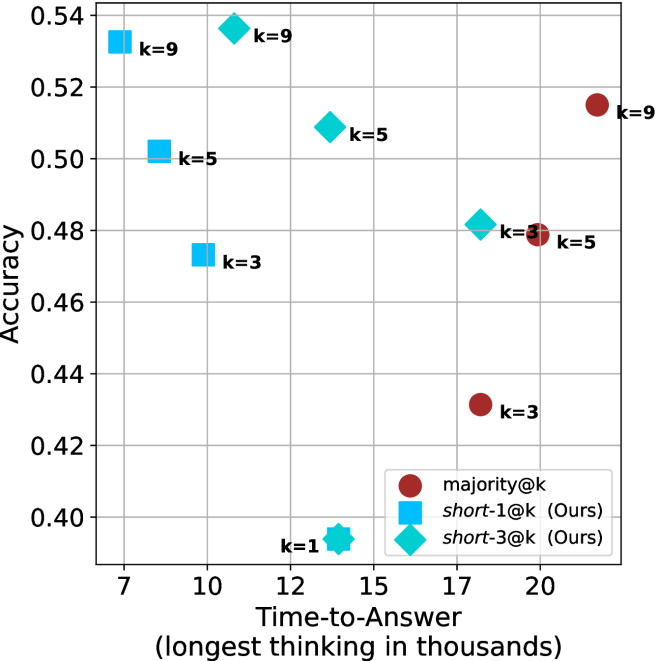
The image is a scatter plot comparing the accuracy of different methods (majority@k, short-1@k, and short-3@k) against the time-to-answer. The x-axis represents the time-to-answer in thousands, and the y-axis represents the accuracy. Each data point is labeled with a 'k' value, indicating a parameter used in the respective method.
### Components/Axes
* **X-axis:** Time-to-Answer (longest thinking in thousands). Scale ranges from 7 to 20, with gridlines at each integer value.
* **Y-axis:** Accuracy. Scale ranges from 0.40 to 0.54, with gridlines at intervals of 0.02.
* **Legend:** Located in the bottom-right corner.
* Red circle: majority@k
* Blue square: short-1@k (Ours)
* Teal diamond: short-3@k (Ours)
* **Data Points:** Each point is labeled with its corresponding 'k' value.
### Detailed Analysis
**1. majority@k (Red Circles):**
* Trend: Accuracy increases with time-to-answer.
* k=3: Time-to-Answer ≈ 17, Accuracy ≈ 0.43
* k=5: Time-to-Answer ≈ 19, Accuracy ≈ 0.48
* k=9: Time-to-Answer ≈ 20.5, Accuracy ≈ 0.515
**2. short-1@k (Blue Squares):**
* Trend: Accuracy decreases with time-to-answer.
* k=9: Time-to-Answer ≈ 7, Accuracy ≈ 0.535
* k=5: Time-to-Answer ≈ 8, Accuracy ≈ 0.50
* k=3: Time-to-Answer ≈ 9.5, Accuracy ≈ 0.47
**3. short-3@k (Teal Diamonds):**
* Trend: Accuracy decreases with time-to-answer.
* k=9: Time-to-Answer ≈ 10, Accuracy ≈ 0.54
* k=5: Time-to-Answer ≈ 14, Accuracy ≈ 0.51
* k=3: Time-to-Answer ≈ 18, Accuracy ≈ 0.48
* k=1: Time-to-Answer ≈ 14, Accuracy ≈ 0.395
### Key Observations
* For the "majority@k" method, increasing the 'k' value and time-to-answer leads to higher accuracy.
* For the "short-1@k" and "short-3@k" methods, increasing the 'k' value generally leads to higher accuracy, but increasing the time-to-answer leads to lower accuracy.
* The "short-3@k" method with k=9 achieves the highest accuracy among all methods.
* The "short-3@k" method with k=1 has the lowest accuracy and the lowest time-to-answer.
### Interpretation
The scatter plot illustrates the trade-off between accuracy and time-to-answer for different methods. The "majority@k" method benefits from longer processing times, while the "short-1@k" and "short-3@k" methods appear to be more effective with shorter processing times. The optimal 'k' value varies depending on the method and the desired balance between accuracy and speed. The "short-3@k" method with k=9 seems to offer the best performance in terms of accuracy, but it's important to consider the time-to-answer implications. The data suggests that "short-1@k" and "short-3@k" are optimized for speed, while "majority@k" is optimized for accuracy.