## Scatter Plot: Accuracy vs. Time-to-Answer
### Overview
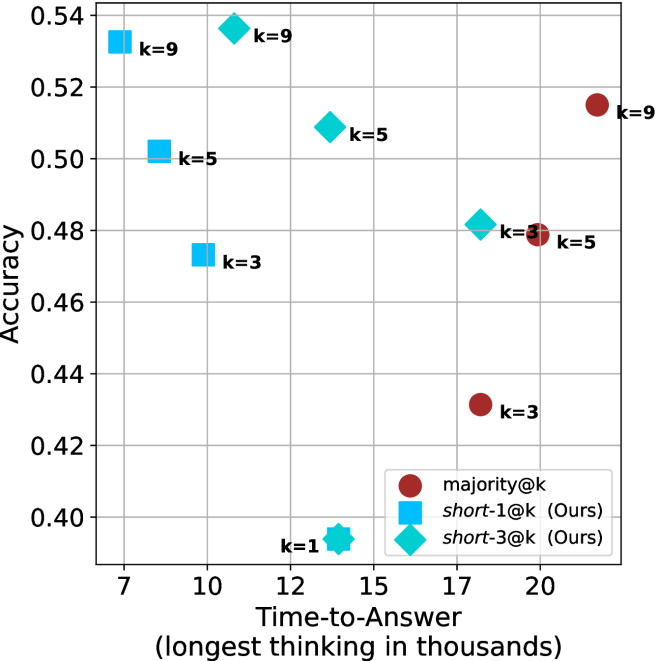
This image is a scatter plot comparing the performance of three different methods—`majority@k`, `short-1@k` (Ours), and `short-3@k` (Ours)—across varying `k` values. The plot evaluates the trade-off between "Accuracy" (Y-axis) and "Time-to-Answer" (X-axis). The data suggests that the "Ours" methods (`short-1@k` and `short-3@k`) generally achieve higher accuracy with lower time-to-answer compared to the `majority@k` baseline.
### Components/Axes
* **Y-Axis:** Labeled "Accuracy". The scale ranges from 0.40 to 0.54, with major grid lines at 0.02 intervals.
* **X-Axis:** Labeled "Time-to-Answer (longest thinking in thousands)". The scale ranges from 7 to 20, with major grid lines at 7, 10, 12, 15, 17, and 20.
* **Legend:** Located in the bottom-right quadrant.
* **Dark Red Circle:** `majority@k`
* **Cyan Square:** `short-1@k (Ours)`
* **Cyan Diamond:** `short-3@k (Ours)`
* **Data Markers:** Each data point is labeled with its corresponding `k` value (e.g., `k=9`, `k=5`, `k=3`, `k=1`).
### Detailed Analysis
The data points are grouped by method and `k` value. Below are the approximate coordinates (X, Y) for each point:
**1. `short-1@k` (Cyan Squares)**
* **Trend:** As `k` increases from 3 to 9, accuracy increases significantly (0.473 to 0.533), while time-to-answer decreases (9.5 to 8).
* `k=9`: (X ≈ 8.0, Y ≈ 0.533)
* `k=5`: (X ≈ 8.5, Y ≈ 0.503)
* `k=3`: (X ≈ 9.5, Y ≈ 0.473)
**2. `short-3@k` (Cyan Diamonds)**
* **Trend:** As `k` increases from 3 to 9, accuracy increases (0.482 to 0.537), while time-to-answer decreases (18 to 11). There is an outlier at `k=1`.
* `k=9`: (X ≈ 11.0, Y ≈ 0.537)
* `k=5`: (X ≈ 14.0, Y ≈ 0.509)
* `k=3`: (X ≈ 18.0, Y ≈ 0.482)
* `k=1`: (X ≈ 14.0, Y ≈ 0.395) — *Note: This point is a cyan star/diamond shape located at the bottom center.*
**3. `majority@k` (Dark Red Circles)**
* **Trend:** As `k` increases from 3 to 9, accuracy increases (0.432 to 0.515), but time-to-answer also increases (18 to 22).
* `k=9`: (X ≈ 22.0, Y ≈ 0.515)
* `k=5`: (X ≈ 20.0, Y ≈ 0.479)
* `k=3`: (X ≈ 18.0, Y ≈ 0.432)
### Key Observations
* **Efficiency Inversion:** The `short` methods exhibit an inverse relationship between `k` and time-to-answer (higher `k` results in faster answers), whereas the `majority@k` method exhibits a direct relationship (higher `k` results in slower answers).
* **Dominance:** The `short-1@k` series is the most efficient, occupying the top-left region of the chart (high accuracy, low time).
* **Performance Ceiling:** The `short-3@k` method achieves the highest overall accuracy (at `k=9`, Y ≈ 0.537) but requires more time than `short-1@k`.
* **Outlier:** The `k=1` point for the `short` series is significantly lower in accuracy (Y ≈ 0.395) than all other data points, suggesting that `k=1` is insufficient for this specific task.
### Interpretation
The data demonstrates that the proposed "short" methods are superior to the `majority@k` baseline in both accuracy and computational efficiency.
The most striking finding is the efficiency gain in the `short` methods as `k` increases. In standard models (like `majority@k`), increasing `k` usually increases latency because the system must process more samples. The fact that `short-1@k` and `short-3@k` become *faster* as `k` increases suggests an "early-exit" or "adaptive computation" mechanism is at play—the system likely finds a confident answer faster when given a larger pool of candidates (`k`), allowing it to terminate the thinking process earlier. This makes the `short` methods highly desirable for real-time applications where both accuracy and latency are critical.