## Heatmap: Relationship Analysis Across CHI, ENV, and LAN Labels
### Overview
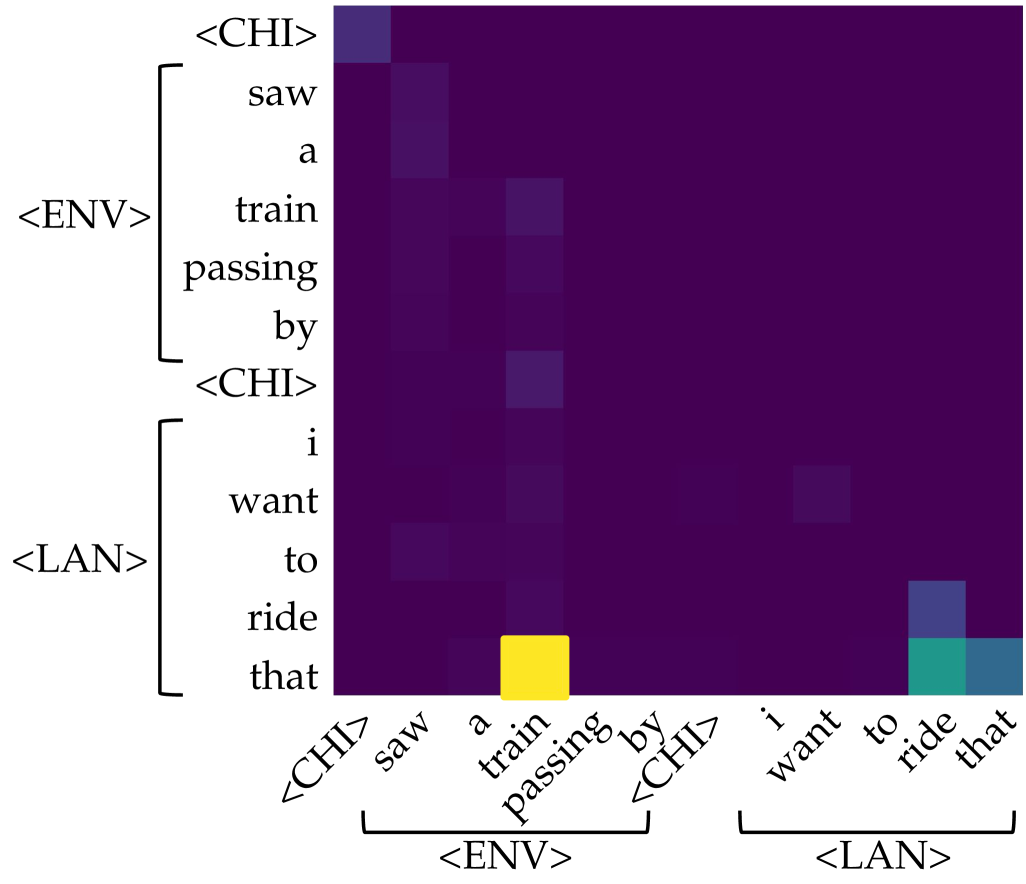
The image is a heatmap divided into three labeled sections (<CHI>, <ENV>, <LAN>) on both axes. Color intensity (purple, yellow, teal) represents data point values, with darker purple indicating lower values and brighter colors (yellow, teal) indicating higher values. The layout suggests a comparative analysis of relationships or interactions between the labeled categories.
### Components/Axes
- **Left Axis (Vertical):**
- Labels: `<CHI>`, `<ENV>`, `<LAN>`
- Sub-labels under each:
- `<CHI>`: "saw", "a", "train", "passing", "by"
- `<ENV>`: "i", "want", "to", "ride", "that"
- `<LAN>`: "i", "want", "to", "ride", "that"
- **Bottom Axis (Horizontal):**
- Labels: `<CHI>`, `<ENV>`, `<LAN>`
- Sub-labels under each:
- `<CHI>`: "saw", "a", "train", "passing", "by"
- `<ENV>`: "i", "want", "to", "ride", "that"
- `<LAN>`: "i", "want", "to", "ride", "that"
- **Legend (Bottom-Right):**
- Purple: Low-value data points
- Yellow: High-value data points
- Teal: Moderate-to-high-value data points
### Detailed Analysis
1. **Top-Left Section (<CHI> × <CHI>):**
- Dominated by dark purple cells, indicating low values.
- Exceptions:
- "saw" (row) and "train" (column) show slightly lighter purple.
- "passing" (row) and "by" (column) have a faint teal cell.
2. **Middle Section (<ENV> × <ENV>):**
- Mostly dark purple, but:
- "train" (row) and "passing" (column) have a bright yellow cell, suggesting a high-value interaction.
- "i" (row) and "want" (column) show a teal cell.
3. **Bottom Section (<LAN> × <LAN>):**
- Dark purple dominates, except:
- "to" (row) and "ride" (column) have a teal cell.
- "that" (row) and "that" (column) show a mix of teal and purple.
4. **Diagonal Pattern:**
- A gradient from dark purple (top-left) to brighter colors (bottom-right) suggests increasing interaction strength or relevance.
### Key Observations
- **High-Value Interactions:**
- `<ENV>`'s "train" and "passing" (yellow) and `<LAN>`'s "to" and "ride" (teal) are notable outliers.
- **Low-Value Dominance:**
- Most cells are dark purple, indicating weak or absent relationships.
- **Color Consistency:**
- Yellow and teal cells align with the legend, confirming their significance.
### Interpretation
The heatmap likely visualizes semantic or contextual relationships between labeled categories. The bright yellow in `<ENV>`'s "train" and "passing" suggests a strong environmental focus on transportation or movement. The teal in `<LAN>`'s "to" and "ride" may indicate moderate relevance to language or location-based actions. The diagonal trend implies a correlation between the labels and their sub-labels, with interactions strengthening toward the bottom-right. The sparse high-value cells highlight specific focal points, while the majority of dark purple cells suggest limited or weak connections elsewhere.