## Chart: Accuracy vs. Thinking Compute
### Overview
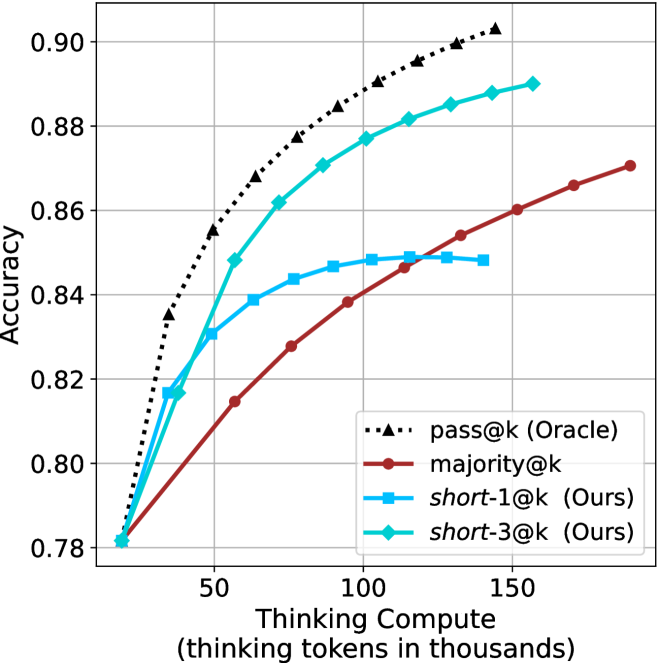
The image is a line chart comparing the accuracy of different methods (pass@k (Oracle), majority@k, short-1@k (Ours), and short-3@k (Ours)) against the thinking compute, measured in thousands of thinking tokens. The chart shows how accuracy improves with increased thinking compute for each method.
### Components/Axes
* **X-axis:** Thinking Compute (thinking tokens in thousands). Scale ranges from 0 to 150, with tick marks at 50, 100, and 150.
* **Y-axis:** Accuracy. Scale ranges from 0.78 to 0.90, with tick marks at 0.78, 0.80, 0.82, 0.84, 0.86, 0.88, and 0.90.
* **Legend:** Located in the bottom-right corner of the chart.
* `pass@k (Oracle)`: Black dotted line with triangle markers.
* `majority@k`: Brown/Red solid line with circle markers.
* `short-1@k (Ours)`: Blue solid line with square markers.
* `short-3@k (Ours)`: Cyan solid line with diamond markers.
### Detailed Analysis
* **pass@k (Oracle):** (Black dotted line with triangle markers)
* Trend: Rapidly increases initially, then the rate of increase slows down.
* Data Points:
* At x=20, y ≈ 0.82
* At x=50, y ≈ 0.86
* At x=100, y ≈ 0.89
* At x=150, y ≈ 0.905
* **majority@k:** (Brown/Red solid line with circle markers)
* Trend: Increases almost linearly.
* Data Points:
* At x=20, y ≈ 0.78
* At x=50, y ≈ 0.81
* At x=75, y ≈ 0.83
* At x=100, y ≈ 0.845
* At x=125, y ≈ 0.855
* At x=150, y ≈ 0.87
* **short-1@k (Ours):** (Blue solid line with square markers)
* Trend: Increases, then plateaus.
* Data Points:
* At x=20, y ≈ 0.78
* At x=50, y ≈ 0.83
* At x=75, y ≈ 0.845
* At x=100, y ≈ 0.847
* At x=125, y ≈ 0.848
* **short-3@k (Ours):** (Cyan solid line with diamond markers)
* Trend: Increases, then the rate of increase slows down.
* Data Points:
* At x=20, y ≈ 0.78
* At x=50, y ≈ 0.82
* At x=75, y ≈ 0.86
* At x=100, y ≈ 0.875
* At x=125, y ≈ 0.882
* At x=150, y ≈ 0.89
### Key Observations
* `pass@k (Oracle)` consistently outperforms the other methods across all thinking compute values.
* `majority@k` shows a steady, linear increase in accuracy as thinking compute increases.
* `short-1@k (Ours)` plateaus in accuracy after a certain point.
* `short-3@k (Ours)` performs better than `short-1@k (Ours)` and `majority@k`, but worse than `pass@k (Oracle)`.
### Interpretation
The chart illustrates the relationship between thinking compute and accuracy for different methods. The `pass@k (Oracle)` method achieves the highest accuracy, suggesting it is the most effective approach. The `majority@k` method shows a consistent improvement with increased compute, while the `short-1@k (Ours)` method reaches a point of diminishing returns. The `short-3@k (Ours)` method provides a balance between performance and compute efficiency. The data suggests that increasing thinking compute generally improves accuracy, but the extent of improvement varies depending on the method used. The "Oracle" method likely represents an upper bound on performance, while the other methods represent practical implementations.