\n
## Diagram: Knowledge Graph and LLM Interaction
### Overview
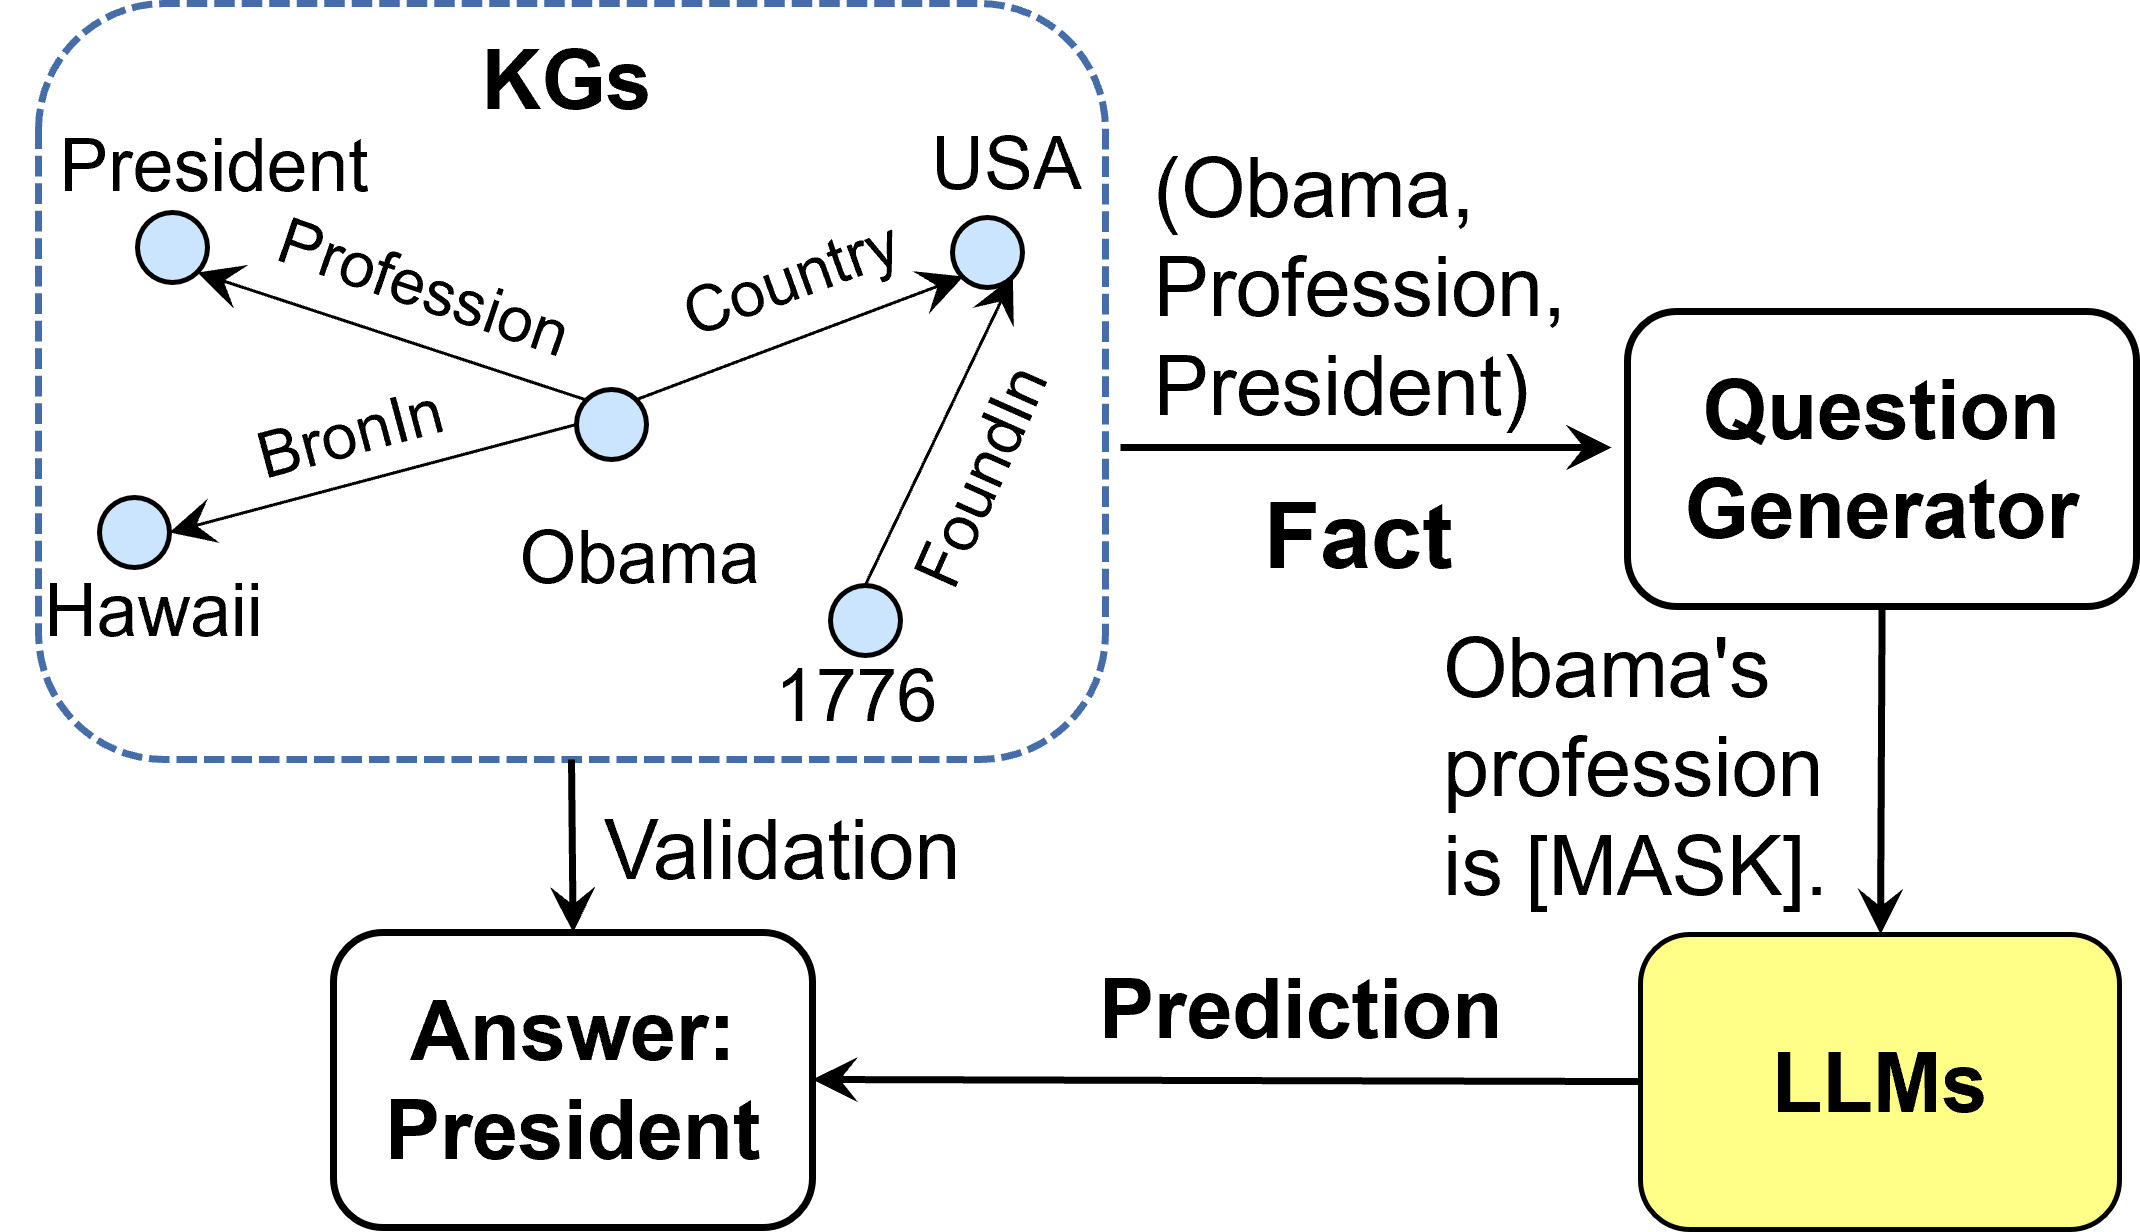
This diagram illustrates a system for question answering using Knowledge Graphs (KGs) and Large Language Models (LLMs). It depicts the flow of information from KGs to generate facts, which are then used by LLMs to predict answers to questions. A validation step is included to confirm the answer against the KG.
### Components/Axes
The diagram consists of the following components:
* **KGs (Knowledge Graphs):** Represented by a dashed-border rectangle at the top-left. Contains nodes representing entities (President, Hawaii, Obama, USA, 1776) and edges representing relationships (Profession, Country, FoundIn, BronIn).
* **Question Generator:** A yellow rectangle on the top-right.
* **Fact:** A light-yellow rectangle between the KGs and the Question Generator.
* **LLMs (Large Language Models):** A yellow rectangle at the bottom-right.
* **Answer:** A dark-grey rectangle at the bottom-left.
* **Edges:** Arrows indicating the flow of information between components. The edges are labeled with descriptions of the process (e.g., "Prediction", "Validation").
### Detailed Analysis or Content Details
The Knowledge Graph contains the following entities and relationships:
* **Entities:** President, Hawaii, Obama, USA, 1776
* **Relationships:**
* President - Profession -> Obama
* Obama - Country -> USA
* USA - FoundIn -> 1776
* Obama - BronIn -> Hawaii
The flow of information is as follows:
1. **KG to Fact:** The KG provides a fact: "(Obama, Profession, President)".
2. **Fact to Question Generator:** The fact is fed into a Question Generator, which creates a question: "Obama's profession is [MASK]".
3. **Question to LLMs:** The question is sent to the LLMs.
4. **LLMs to Prediction:** The LLMs generate a prediction.
5. **Prediction to Answer:** The prediction is used to formulate an answer: "President".
6. **KG to Validation:** The answer is validated against the KG.
### Key Observations
* The diagram highlights a closed-loop system where the LLM's prediction is validated against the knowledge graph.
* The use of "[MASK]" in the question suggests a fill-in-the-blank format.
* The diagram focuses on a single example (Obama's profession) to illustrate the process.
* The diagram does not provide any numerical data or quantitative measurements.
### Interpretation
The diagram demonstrates a method for leveraging knowledge graphs to improve the accuracy and reliability of question answering systems powered by LLMs. By grounding the LLM's predictions in a structured knowledge base, the system can reduce the risk of generating incorrect or hallucinated answers. The validation step is crucial for ensuring that the LLM's output is consistent with established facts. The diagram suggests a pipeline where KGs provide factual information, LLMs perform reasoning and prediction, and a validation mechanism ensures the correctness of the final answer. The use of a masked question format indicates a focus on knowledge completion or retrieval tasks. The diagram is a conceptual illustration of a system architecture rather than a presentation of empirical results.