## t-SNE Visualization: Decomposed Factors
### Overview
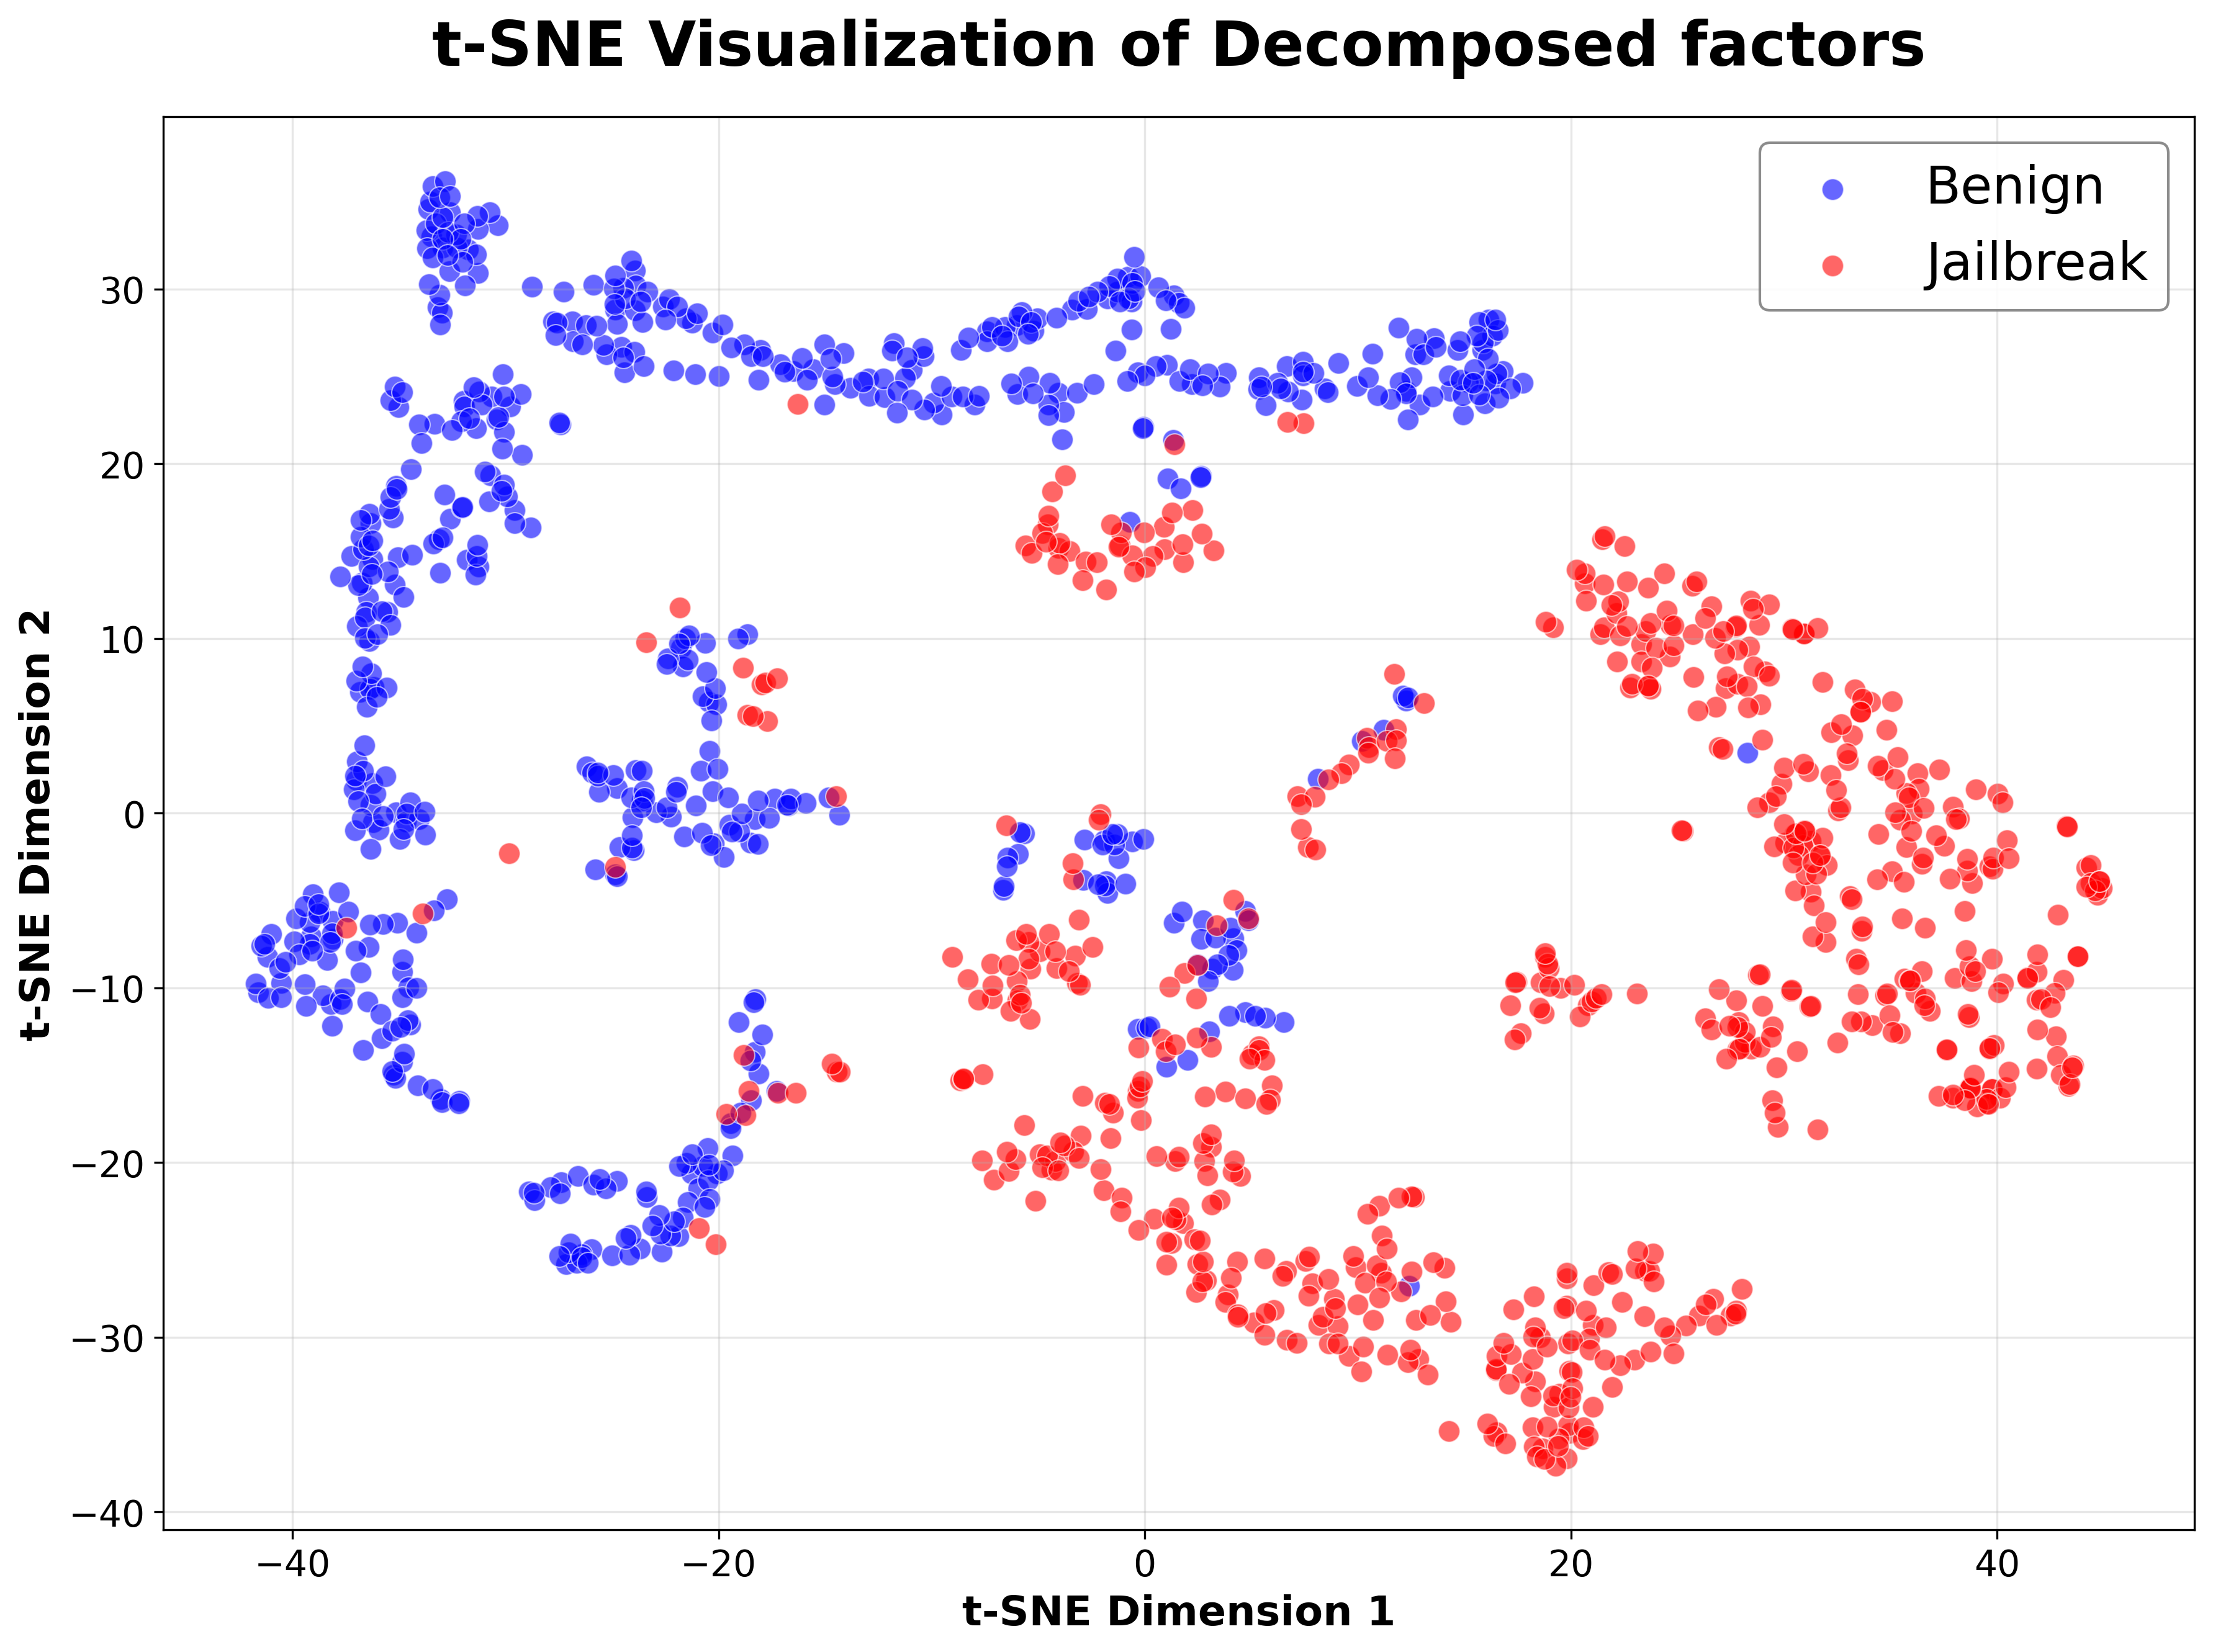
This is a two-dimensional t-SNE (t-distributed Stochastic Neighbor Embedding) visualization showing the distribution of two categories: "Benign" (blue) and "Jailbreak" (red). The plot reveals spatial clustering patterns between the two groups across decomposed factors.
### Components/Axes
- **X-axis**: t-SNE Dimension 1 (ranges approximately from -40 to +40)
- **Y-axis**: t-SNE Dimension 2 (ranges approximately from -40 to +40)
- **Legend**: Located in the top-right corner, with:
- Blue circles labeled "Benign"
- Red circles labeled "Jailbreak"
### Detailed Analysis
1. **Benign (Blue) Cluster**:
- Dominates the upper-left quadrant (X: -40 to 0, Y: 0 to 30)
- Forms a dense, irregularly shaped cluster with high point density
- Extends diagonally toward the upper-right quadrant (X: 0 to 20, Y: 10 to 30)
- Contains a few outliers near the lower-left quadrant (X: -30 to -10, Y: -10 to 0)
2. **Jailbreak (Red) Cluster**:
- Concentrated in the lower-right quadrant (X: 10 to 40, Y: -30 to 0)
- Forms a large, dense cluster with a secondary smaller cluster near the center (X: 0 to 10, Y: -10 to 0)
- Extends into the upper-right quadrant (X: 20 to 40, Y: 0 to 10) with lower density
- Contains a few outliers near the center (X: -10 to 10, Y: -10 to 10)
3. **Overlap Region**:
- Significant overlap occurs in the central region (X: -10 to 10, Y: -10 to 10)
- Approximately 15-20% of points in this region show mixed colors
- Notable overlap density near (X: 0, Y: 0) and (X: 10, Y: 0)
### Key Observations
- **Distinct Grouping**: Benign and Jailbreak categories exhibit clear spatial separation in most regions
- **Dimensional Correlation**:
- Benign points correlate with higher Y-values (positive t-SNE Dimension 2)
- Jailbreak points correlate with higher X-values (positive t-SNE Dimension 1)
- **Outlier Patterns**:
- Benign outliers appear in lower-left quadrant
- Jailbreak outliers appear near the center and upper-right quadrant
- **Density Gradients**:
- Benign density peaks near (X: -20, Y: 20)
- Jailbreak density peaks near (X: 30, Y: -20)
### Interpretation
This visualization demonstrates effective separation between Benign and Jailbreak categories in the decomposed factor space, suggesting the t-SNE model successfully captures meaningful distinctions. The central overlap region indicates potential ambiguity in factor decomposition for certain samples, possibly representing edge cases or transitional states between categories. The diagonal distribution pattern implies that the first two decomposed factors capture orthogonal aspects of the data, with Dimension 1 primarily distinguishing Jailbreak samples and Dimension 2 primarily distinguishing Benign samples. The outlier patterns suggest potential areas for model refinement, particularly in the central overlap region where classification confidence may be lower.