## Line Chart: Accuracy vs. Thinking Compute
### Overview
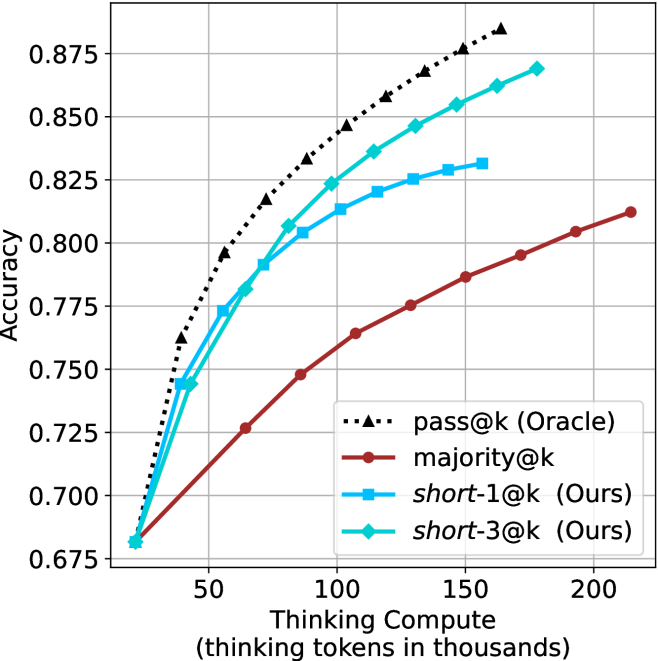
This chart illustrates the relationship between "Thinking Compute" (measured in thousands of thinking tokens) and model "Accuracy." It compares four distinct evaluation strategies: `pass@k (Oracle)`, `majority@k`, and two methods labeled as "Ours" (`short-1@k` and `short-3@k`). All methods show a positive correlation between increased compute and improved accuracy, following a logarithmic-style growth curve where gains diminish as compute increases.
### Components/Axes
* **Y-Axis (Vertical):** Labeled "Accuracy." The scale ranges from 0.675 to 0.875, with major grid lines marked at intervals of 0.025.
* **X-Axis (Horizontal):** Labeled "Thinking Compute (thinking tokens in thousands)." The scale ranges from 50 to 200, with major grid lines marked at intervals of 50. Data points begin at approximately 25.
* **Legend:** Positioned in the bottom-right quadrant of the chart area.
* **`pass@k (Oracle)`**: Black dotted line with triangle markers.
* **`majority@k`**: Dark red solid line with circle markers.
* **`short-1@k (Ours)`**: Light blue solid line with square markers.
* **`short-3@k (Ours)`**: Cyan/Teal solid line with diamond markers.
### Detailed Analysis
All four data series originate from a common starting point at approximately (x=25, y=0.68). As compute increases, the series diverge into a clear performance hierarchy.
**1. `pass@k (Oracle)` (Black, Dotted, Triangles)**
* **Trend:** Steepest upward slope; consistently the highest performing series.
* **Data Points (Approximate):**
* x=40, y≈0.76
* x=60, y≈0.795
* x=90, y≈0.835
* x=120, y≈0.86
* x=165, y≈0.885
**2. `short-3@k (Ours)` (Cyan/Teal, Solid, Diamonds)**
* **Trend:** Strong upward slope, tracking closely behind the Oracle.
* **Data Points (Approximate):**
* x=40, y≈0.745
* x=60, y≈0.78
* x=90, y≈0.805
* x=120, y≈0.845
* x=165, y≈0.87
**3. `short-1@k (Ours)` (Light Blue, Solid, Squares)**
* **Trend:** Upward slope, but begins to plateau earlier than the Oracle or `short-3@k`.
* **Data Points (Approximate):**
* x=40, y≈0.745
* x=60, y≈0.775
* x=90, y≈0.805
* x=120, y≈0.82
* x=160, y≈0.83
**4. `majority@k` (Dark Red, Solid, Circles)**
* **Trend:** The slowest growth rate; consistently the lowest performing series.
* **Data Points (Approximate):**
* x=60, y≈0.725
* x=100, y≈0.765
* x=140, y≈0.785
* x=180, y≈0.805
* x=215, y≈0.815
### Key Observations
* **Performance Hierarchy:** The performance order is consistently `pass@k (Oracle)` > `short-3@k` > `short-1@k` > `majority@k`.
* **Efficiency Gap:** The "Ours" methods (`short-1` and `short-3`) significantly outperform the `majority@k` baseline. For example, at 100k tokens, `short-3@k` achieves an accuracy of ~0.82, whereas `majority@k` requires over 200k tokens to reach ~0.81.
* **Diminishing Returns:** All curves exhibit a concave shape, indicating that as more thinking tokens are allocated, the marginal gain in accuracy decreases. This is most pronounced in the `short-1@k` series, which flattens significantly after 120k tokens.
### Interpretation
This chart demonstrates the efficacy of the proposed "short" thinking strategies compared to standard majority voting (`majority@k`).
* **Strategic Advantage:** The "Ours" methods are clearly optimized to extract higher accuracy from the model with significantly less compute than the `majority@k` baseline.
* **Scaling Behavior:** The `short-3@k` method maintains a trajectory closer to the theoretical "Oracle" limit than `short-1@k`, suggesting that allowing for slightly more "short" thinking paths (or a different selection mechanism) yields better results.
* **Practical Implication:** For a system designer, this data suggests that using `short-3@k` provides a superior trade-off between computational cost (thinking tokens) and accuracy compared to the standard `majority@k` approach, effectively shifting the accuracy curve upward and to the left.