## Line Chart: Accuracy vs. Thinking Compute
### Overview
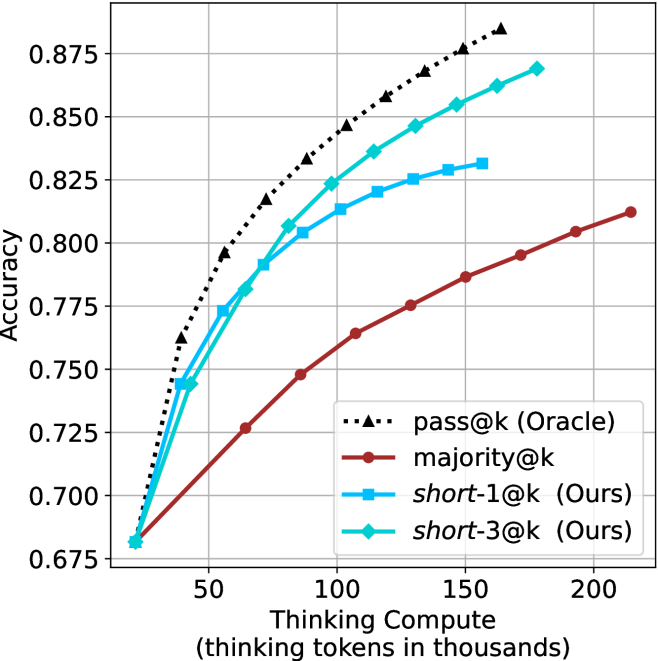
The image is a line chart comparing the accuracy of different methods (pass@k, majority@k, short-1@k, and short-3@k) as a function of thinking compute, measured in thousands of thinking tokens. The chart shows how accuracy increases with more compute for each method.
### Components/Axes
* **X-axis:** Thinking Compute (thinking tokens in thousands). Scale ranges from 0 to 200 in increments of 50.
* **Y-axis:** Accuracy. Scale ranges from 0.675 to 0.875 in increments of 0.025.
* **Legend:** Located in the bottom-right of the chart.
* Black dotted line with triangle markers: pass@k (Oracle)
* Brown line with circle markers: majority@k
* Blue line with square markers: short-1@k (Ours)
* Cyan line with diamond markers: short-3@k (Ours)
### Detailed Analysis
* **pass@k (Oracle):** (Black dotted line with triangle markers)
* Trend: Slopes upward, with decreasing gains as compute increases.
* Data Points:
* At 25k compute, accuracy is approximately 0.745.
* At 50k compute, accuracy is approximately 0.805.
* At 75k compute, accuracy is approximately 0.835.
* At 100k compute, accuracy is approximately 0.855.
* At 150k compute, accuracy is approximately 0.870.
* At 200k compute, accuracy is approximately 0.880.
* **majority@k:** (Brown line with circle markers)
* Trend: Slopes upward, approximately linear.
* Data Points:
* At 25k compute, accuracy is approximately 0.685.
* At 50k compute, accuracy is approximately 0.725.
* At 75k compute, accuracy is approximately 0.755.
* At 100k compute, accuracy is approximately 0.775.
* At 150k compute, accuracy is approximately 0.795.
* At 200k compute, accuracy is approximately 0.810.
* **short-1@k (Ours):** (Blue line with square markers)
* Trend: Slopes upward, with decreasing gains as compute increases.
* Data Points:
* At 25k compute, accuracy is approximately 0.685.
* At 50k compute, accuracy is approximately 0.775.
* At 75k compute, accuracy is approximately 0.800.
* At 100k compute, accuracy is approximately 0.820.
* At 150k compute, accuracy is approximately 0.825.
* At 200k compute, accuracy is approximately 0.830.
* **short-3@k (Ours):** (Cyan line with diamond markers)
* Trend: Slopes upward, with decreasing gains as compute increases.
* Data Points:
* At 25k compute, accuracy is approximately 0.680.
* At 50k compute, accuracy is approximately 0.745.
* At 75k compute, accuracy is approximately 0.790.
* At 100k compute, accuracy is approximately 0.820.
* At 150k compute, accuracy is approximately 0.855.
* At 200k compute, accuracy is approximately 0.860.
### Key Observations
* The "pass@k (Oracle)" method consistently achieves the highest accuracy across all compute levels.
* The "majority@k" method has the lowest accuracy and a nearly linear increase with compute.
* The "short-1@k (Ours)" and "short-3@k (Ours)" methods perform similarly, with "short-3@k" generally having slightly higher accuracy.
* All methods show diminishing returns in accuracy as compute increases, especially beyond 100k thinking tokens.
### Interpretation
The chart demonstrates the relationship between computational resources (thinking tokens) and the accuracy of different methods. The "pass@k (Oracle)" method serves as an upper bound or ideal performance, while "majority@k" represents a baseline. The "short-1@k" and "short-3@k" methods, developed by the authors ("Ours"), aim to improve upon the baseline. The data suggests that increasing thinking compute generally improves accuracy, but the gains diminish as compute increases. The "short-3@k" method appears to be a more effective approach than "short-1@k," achieving higher accuracy for a given compute level. The diminishing returns suggest that there may be a point of saturation where additional compute provides minimal improvement in accuracy, and other factors may become more important.