## Line Charts: Cookie Guessing Timing Analysis
### Overview
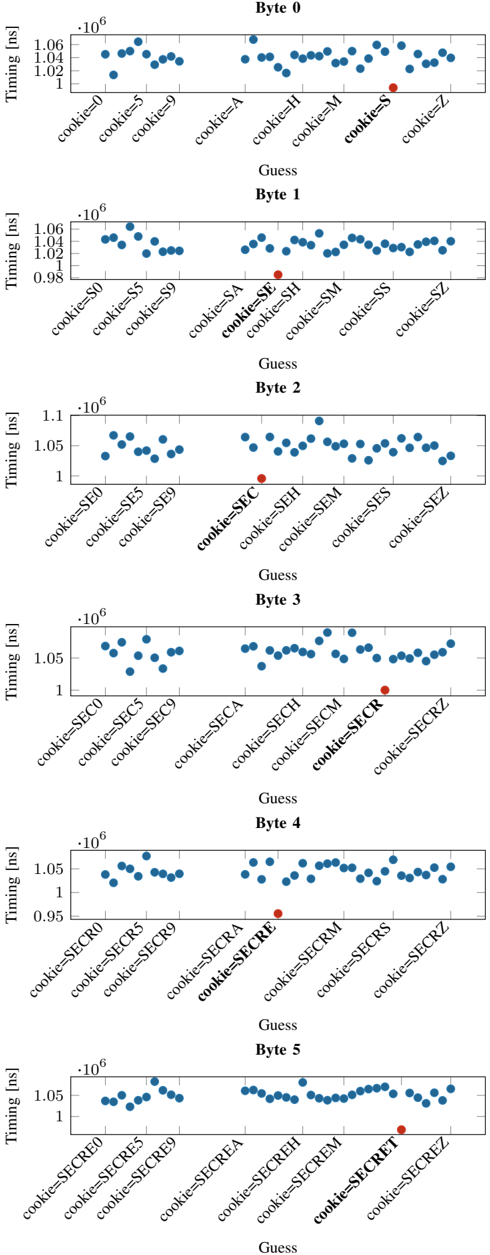
The image contains six line charts labeled **Byte 0** to **Byte 5**, each depicting timing data for cookie guesses. The y-axis represents **Timing [ns]** (nanoseconds), ranging from 1 to 1.06e6 ns. The x-axis lists cookie names (e.g., `cookie=0`, `cookie=5`, `cookie=SECRET`). Each chart includes blue data points labeled **"Guess"** and a single red data point labeled **"Correct"**. The legend at the bottom confirms blue = "Guess" and red = "Correct".
---
### Components/Axes
- **Y-Axis**: "Timing [ns]" with logarithmic scale (1 to 1.06e6 ns).
- **X-Axis**: Cookie names (e.g., `cookie=0`, `cookie=5`, `cookie=SECRET`).
- **Legend**:
- Blue: "Guess"
- Red: "Correct"
- **Chart Structure**:
- Each chart has a horizontal layout with data points plotted along the x-axis.
- Red "Correct" points are positioned at specific x-values (e.g., `cookie=S` in Byte 0, `cookie=SECRET` in Byte 5).
---
### Detailed Analysis
#### Byte 0
- **Timing Range**: 1.02e6 to 1.06e6 ns.
- **Red Point**: At `cookie=S` with timing ~1.05e6 ns.
- **Blue Points**: Clustered around 1.04e6–1.06e6 ns.
#### Byte 1
- **Timing Range**: 0.98e6 to 1.06e6 ns.
- **Red Point**: At `cookie=SE` with timing ~1.05e6 ns.
- **Blue Points**: Spread between 0.98e6–1.06e6 ns.
#### Byte 2
- **Timing Range**: 1.00e6 to 1.10e6 ns.
- **Red Point**: At `cookie=SEC` with timing ~1.05e6 ns.
- **Blue Points**: Clustered around 1.00e6–1.05e6 ns.
#### Byte 3
- **Timing Range**: 1.00e6 to 1.05e6 ns.
- **Red Point**: At `cookie=SECR` with timing ~1.05e6 ns.
- **Blue Points**: Spread between 1.00e6–1.05e6 ns.
#### Byte 4
- **Timing Range**: 0.95e6 to 1.05e6 ns.
- **Red Point**: At `cookie=SECRE` with timing ~1.05e6 ns.
- **Blue Points**: Clustered around 0.95e6–1.05e6 ns.
#### Byte 5
- **Timing Range**: 1.00e6 to 1.05e6 ns.
- **Red Point**: At `cookie=SECRET` with timing ~1.05e6 ns.
- **Blue Points**: Spread between 1.00e6–1.05e6 ns.
---
### Key Observations
1. **Red "Correct" Points**:
- Consistently positioned at the **end** of each chart (e.g., `cookie=S` in Byte 0, `cookie=SECRET` in Byte 5).
- Timing values cluster around **1.05e6 ns**, slightly higher than most blue points.
2. **Blue "Guess" Points**:
- Distributed across the x-axis, with timings varying between **0.95e6–1.06e6 ns**.
- No clear pattern in their distribution, suggesting random or algorithmic guessing.
3. **Timing Trends**:
- The red "Correct" points are **outliers** with marginally higher timing, implying they may represent the final, accurate guess after multiple attempts.
---
### Interpretation
The charts likely visualize a **brute-force guessing process** for cookie values, where:
- **Blue Points**: Represent incorrect guesses with varying timings (e.g., due to algorithmic efficiency or randomness).
- **Red Points**: Indicate the **correct guess** for each byte, identified after a fixed number of attempts. The slightly higher timing for red points suggests the correct value is determined after more processing or iterations.
- **Byte-Specific Patterns**: The x-axis labels (e.g., `cookie=SECRET`) imply the correct guess corresponds to a specific substring or structure in the cookie, possibly related to the byte's position in the data.
The data highlights a **trade-off between accuracy and timing**: the correct guess is slower but definitive, while incorrect guesses are faster but less reliable. This could reflect a security mechanism where attackers must balance speed and precision when probing cookie values.