## Violin Plot: Token Probability Distribution for Language Models
### Overview
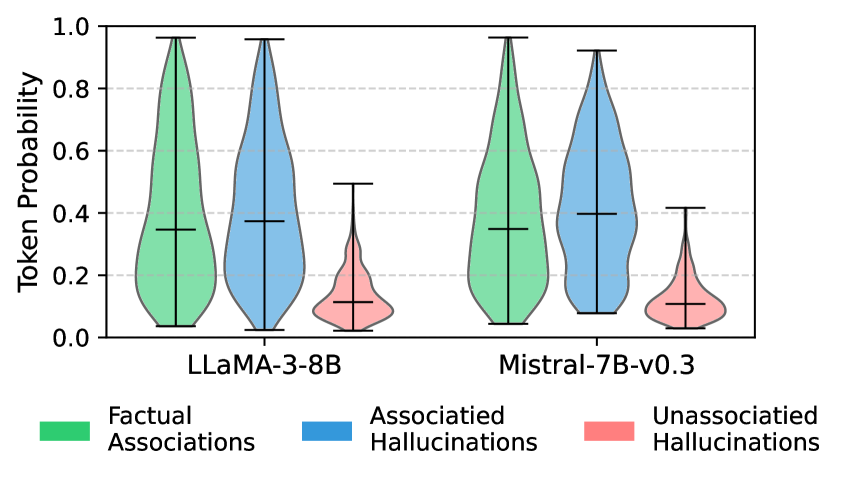
The image presents a violin plot comparing the token probability distributions of two language models, LLaMA-3-8B and Mistral-7B-v0.3, across three categories: Factual Associations, Associated Hallucinations, and Unassociated Hallucinations. The plot visualizes the spread and central tendency of token probabilities for each model and category.
### Components/Axes
* **Y-axis:** "Token Probability" ranging from 0.0 to 1.0, with gridlines at intervals of 0.2.
* **X-axis:** Categorical axis representing the two language models: "LLaMA-3-8B" and "Mistral-7B-v0.3".
* **Violin Plots:** Each violin plot represents the distribution of token probabilities for a specific model and category. The width of the violin indicates the density of data points at that probability level.
* **Legend:** Located at the bottom of the chart.
* Green: "Factual Associations"
* Blue: "Associated Hallucinations"
* Red: "Unassociated Hallucinations"
### Detailed Analysis
The plot is structured with two main groups, one for each language model (LLaMA-3-8B and Mistral-7B-v0.3). Within each group, there are three violin plots representing the three categories: Factual Associations (green), Associated Hallucinations (blue), and Unassociated Hallucinations (red).
**LLaMA-3-8B:**
* **Factual Associations (Green):** The distribution is centered around 0.35, with a wide spread indicating variability in token probabilities. The distribution extends from approximately 0.05 to 0.95.
* **Associated Hallucinations (Blue):** Similar to Factual Associations, the distribution is centered around 0.38, with a wide spread. The distribution extends from approximately 0.08 to 0.95.
* **Unassociated Hallucinations (Red):** The distribution is centered around 0.12, with a narrower spread compared to the other two categories. The distribution extends from approximately 0.02 to 0.45.
**Mistral-7B-v0.3:**
* **Factual Associations (Green):** The distribution is centered around 0.35, with a wide spread, similar to LLaMA-3-8B. The distribution extends from approximately 0.05 to 0.95.
* **Associated Hallucinations (Blue):** Similar to Factual Associations, the distribution is centered around 0.40, with a wide spread. The distribution extends from approximately 0.08 to 0.92.
* **Unassociated Hallucinations (Red):** The distribution is centered around 0.11, with a narrower spread compared to the other two categories, similar to LLaMA-3-8B. The distribution extends from approximately 0.02 to 0.42.
### Key Observations
* For both models, the distributions of "Factual Associations" and "Associated Hallucinations" are similar in shape and spread, with medians around 0.35-0.40.
* "Unassociated Hallucinations" have a much lower median token probability (around 0.11-0.12) and a narrower distribution compared to the other two categories for both models.
* The distributions for each category are very similar between the two models.
### Interpretation
The violin plot suggests that both language models exhibit similar patterns in token probability distributions across the three categories. The higher token probabilities for "Factual Associations" and "Associated Hallucinations" compared to "Unassociated Hallucinations" may indicate that the models are more confident in generating tokens related to factual information or associated concepts, even when those associations lead to hallucinations. The lower token probabilities for "Unassociated Hallucinations" might reflect the model's lower confidence in generating tokens that are completely unrelated to the input context. The similarity between the two models suggests that they may share similar biases or patterns in their token generation processes.