\n
## Diagram: Representation of a Region in a 2D Space
### Overview
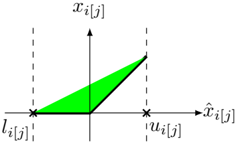
The image depicts a two-dimensional Cartesian coordinate system with a shaded triangular region. The axes are labeled, and points within the region are marked with specific notations. The diagram appears to represent a constraint or feasible region defined by the axes and the points.
### Components/Axes
* **Horizontal Axis:** Labeled as `x̂ᵢ[j]` (x-hat i j).
* **Vertical Axis:** Labeled as `xᵢ[j]` (x i j).
* **Points:**
* `lᵢ[j]` (l i j): Located on the negative x̂ᵢ[j] axis.
* `uᵢ[j]` (u i j): Located on the positive x̂ᵢ[j] axis.
* **Shaded Region:** A green triangle formed by the origin (0,0), the point `lᵢ[j]`, and the point `uᵢ[j]`. The region is bounded by the x̂ᵢ[j] axis, the xᵢ[j] axis, and a line connecting `lᵢ[j]` and `uᵢ[j]`.
### Detailed Analysis
The diagram shows a region defined by the following:
* The x̂ᵢ[j] axis represents a horizontal dimension.
* The xᵢ[j] axis represents a vertical dimension.
* The point `lᵢ[j]` is located at an unknown negative value on the x̂ᵢ[j] axis.
* The point `uᵢ[j]` is located at an unknown positive value on the x̂ᵢ[j] axis.
* The shaded triangular region represents all points (x̂ᵢ[j], xᵢ[j]) such that `lᵢ[j] ≤ x̂ᵢ[j] ≤ uᵢ[j]` and `0 ≤ xᵢ[j]`.
The line connecting `lᵢ[j]` and `uᵢ[j]` has a positive slope. The exact equation of the line is not provided, but it can be inferred that it passes through the origin.
### Key Observations
* The diagram represents a constraint or feasible region.
* The region is bounded by the axes and the line segment connecting `lᵢ[j]` and `uᵢ[j]`.
* The values of `lᵢ[j]` and `uᵢ[j]` are not explicitly given, but they define the boundaries of the region.
* The region is a right triangle with the right angle at the origin.
### Interpretation
This diagram likely represents a constraint in an optimization problem or a feasible region in a linear programming context. The variables `x̂ᵢ[j]` and `xᵢ[j]` could represent any two quantities, and the constraints defined by `lᵢ[j]` and `uᵢ[j]` limit the possible values of these variables. The shaded region represents the set of all possible combinations of `x̂ᵢ[j]` and `xᵢ[j]` that satisfy the constraints.
The notation `i[j]` suggests that these variables might be indexed by `i` and `j`, potentially representing elements in a matrix or a sequence. The use of "hat" notation (x̂ᵢ[j]) could indicate a normalized or estimated value.
Without further context, it's difficult to determine the specific meaning of the diagram. However, it clearly illustrates a constrained region in a two-dimensional space, likely representing a set of feasible solutions or a constraint in a mathematical model.