## Line Chart: Accuracy vs. Thinking Compute
### Overview
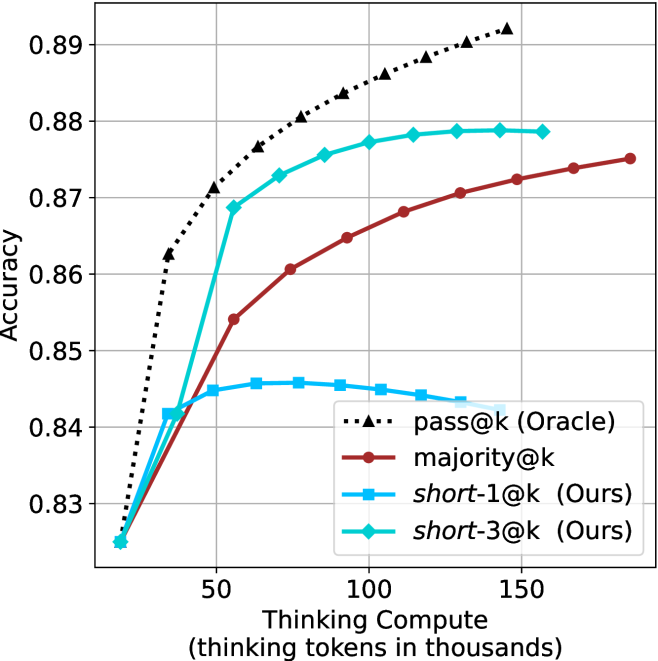
The image is a line chart comparing the accuracy of different models ("pass@k (Oracle)", "majority@k", "short-1@k (Ours)", and "short-3@k (Ours)") as a function of "Thinking Compute" (measured in thousands of thinking tokens). The chart shows how accuracy changes as the models are given more computational resources.
### Components/Axes
* **X-axis:** "Thinking Compute (thinking tokens in thousands)". The scale ranges from approximately 20 to 170, with major ticks at 50, 100, and 150.
* **Y-axis:** "Accuracy". The scale ranges from 0.83 to 0.89, with major ticks at 0.83, 0.84, 0.85, 0.86, 0.87, 0.88, and 0.89.
* **Legend:** Located on the right side of the chart.
* Black dotted line with triangle markers: "pass@k (Oracle)"
* Brown line with circle markers: "majority@k"
* Light blue line with square markers: "short-1@k (Ours)"
* Teal line with diamond markers: "short-3@k (Ours)"
### Detailed Analysis
* **pass@k (Oracle) (Black dotted line with triangle markers):** The line starts at approximately (20, 0.825) and increases rapidly to approximately (50, 0.87), then continues to increase at a slower rate, reaching approximately (160, 0.891). The trend is upward, with diminishing returns as Thinking Compute increases.
* **majority@k (Brown line with circle markers):** The line starts at approximately (20, 0.825) and increases steadily to approximately (160, 0.875). The trend is upward, with a decreasing slope as Thinking Compute increases.
* **short-1@k (Ours) (Light blue line with square markers):** The line starts at approximately (20, 0.825), increases to approximately (60, 0.846), and then decreases slightly to approximately (160, 0.845). The trend is initially upward, then slightly downward, forming a plateau.
* **short-3@k (Ours) (Teal line with diamond markers):** The line starts at approximately (20, 0.825), increases rapidly to approximately (50, 0.87), and then increases slowly to approximately (140, 0.879). The trend is upward, with diminishing returns as Thinking Compute increases.
### Key Observations
* The "pass@k (Oracle)" model consistently achieves the highest accuracy across all levels of Thinking Compute.
* The "short-3@k (Ours)" model performs better than the "majority@k" model and the "short-1@k (Ours)" model.
* The "short-1@k (Ours)" model plateaus and even decreases slightly in accuracy as Thinking Compute increases beyond a certain point.
* All models show diminishing returns in accuracy as Thinking Compute increases, suggesting that there is a limit to how much accuracy can be gained by simply increasing computational resources.
### Interpretation
The chart demonstrates the relationship between the amount of computational resources (Thinking Compute) and the accuracy of different models. The "pass@k (Oracle)" model serves as an upper bound or ideal performance, while the other models ("majority@k", "short-1@k (Ours)", and "short-3@k (Ours)") show varying levels of performance. The "short-3@k (Ours)" model appears to be the most effective of the "Ours" models, approaching the performance of the "pass@k (Oracle)" model at higher levels of Thinking Compute. The plateauing or decreasing accuracy of the "short-1@k (Ours)" model suggests that there may be a point of diminishing returns or even overfitting with this particular model as Thinking Compute increases. The data suggests that optimizing the model architecture (as potentially done in "short-3@k") is more effective than simply increasing computational resources.