## Line Chart: Accuracy vs. Thinking Compute
### Overview
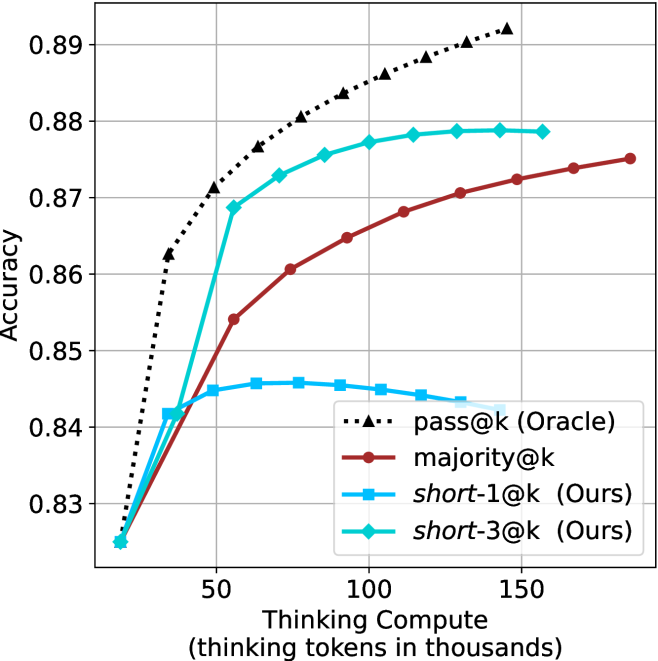
This chart illustrates the relationship between "Thinking Compute" (measured in thousands of thinking tokens) and model "Accuracy." It compares four different strategies for utilizing thinking tokens: an Oracle baseline, a majority voting method, and two "short" selection methods (1@k and 3@k). The chart demonstrates how different strategies scale in accuracy as more compute is allocated.
### Components/Axes
* **Y-Axis**: Labeled "Accuracy." The scale ranges from 0.82 to 0.89, with major grid lines at 0.01 intervals.
* **X-Axis**: Labeled "Thinking Compute (thinking tokens in thousands)." The scale ranges from approximately 20 to 180.
* **Legend**: Located in the bottom-right quadrant of the chart area.
* **`pass@k (Oracle)`**: Black dotted line with triangle markers.
* **`majority@k`**: Dark red solid line with circle markers.
* **`short-1@k (Ours)`**: Light blue solid line with square markers.
* **`short-3@k (Ours)`**: Cyan/Teal solid line with diamond markers.
### Detailed Analysis
#### Data Series Trends and Values
* **`pass@k (Oracle)` (Black dotted line, triangles)**:
* **Trend**: This line shows the steepest, most consistent upward trajectory, representing the theoretical upper bound of performance.
* **Values**: Starts at ~0.825 at 20k tokens. It rises sharply to ~0.862 at 25k tokens, ~0.871 at 50k tokens, ~0.877 at 75k tokens, ~0.884 at 100k tokens, ~0.888 at 125k tokens, and reaches ~0.892 at 145k tokens.
* **`short-3@k (Ours)` (Cyan/Teal solid line, diamonds)**:
* **Trend**: Shows a rapid initial increase in accuracy, followed by a logarithmic saturation curve. It is the most efficient method among the non-oracle approaches.
* **Values**: Starts at ~0.825 at 20k tokens. It rises to ~0.842 at 25k tokens, ~0.869 at 55k tokens, ~0.873 at 75k tokens, ~0.876 at 90k tokens, ~0.878 at 110k tokens, and plateaus around 0.879 by 155k tokens.
* **`majority@k` (Dark red solid line, circles)**:
* **Trend**: Shows a steady, consistent, and nearly linear upward slope. It does not saturate as quickly as the "short" methods.
* **Values**: Starts at ~0.825 at 20k tokens. It reaches ~0.835 at 25k tokens, ~0.854 at 55k tokens, ~0.861 at 75k tokens, ~0.865 at 100k tokens, ~0.871 at 125k tokens, ~0.873 at 150k tokens, and ~0.875 at 185k tokens.
* **`short-1@k (Ours)` (Light blue solid line, squares)**:
* **Trend**: Shows an initial increase, peaks, and then exhibits a slight decline, suggesting diminishing returns or "overthinking" penalties.
* **Values**: Starts at ~0.825 at 20k tokens. It rises to ~0.842 at 25k tokens, peaks at ~0.846 at 75k tokens, and then slowly declines to ~0.843 at 130k tokens.
### Key Observations
* **Efficiency vs. Ceiling**: The `short-3@k` method is significantly more efficient than `majority@k` at lower compute budgets (under 100k tokens), reaching higher accuracy faster.
* **Overthinking Penalty**: The `short-1@k` line is the only one that exhibits a negative slope after a certain point (approx. 75k tokens), indicating that simply generating more tokens without a robust selection strategy (like the "3" in 3@k) can degrade performance.
* **Convergence**: All methods start at the same baseline accuracy (~0.825) at the lowest compute level.
### Interpretation
This chart likely originates from research into Large Language Model (LLM) inference-time compute (often referred to as "Chain-of-Thought" or "Test-time compute").
The data suggests that **selection strategy matters more than raw compute**. By using a "short-3@k" approach, the model achieves high accuracy with significantly fewer tokens than the "majority@k" approach. The "Oracle" line represents the ceiling of what is possible if the model could perfectly select the best answer from the generated tokens. The decline in the `short-1@k` line is a classic indicator of "overthinking" or "drift," where the model generates more content that eventually introduces noise or errors, thereby reducing the overall accuracy.