## Diagram: Deep Neural Network Association
### Overview
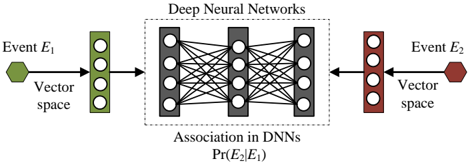
The image is a diagram illustrating the association between two events, E1 and E2, using a deep neural network (DNN). It shows the flow of information from Event E1 through a vector space into the DNN, and then from the DNN through another vector space to Event E2.
### Components/Axes
* **Title:** Deep Neural Networks
* **Left Side:**
* Event E1 (represented by a green hexagon)
* Vector space (text label)
* A green column of 4 circles
* Arrow pointing from the hexagon to the column of circles, and another arrow pointing from the column of circles to the DNN.
* **Center:**
* Deep Neural Network (DNN) - Represented by three gray columns of 4 circles each, fully connected by lines.
* Association in DNNs (text label below the DNN)
* Pr(E2|E1) (Probability of E2 given E1, text label below "Association in DNNs")
* **Right Side:**
* Event E2 (represented by a red hexagon)
* Vector space (text label)
* A red column of 4 circles
* Arrow pointing from the DNN to the column of circles, and another arrow pointing from the column of circles to the hexagon.
### Detailed Analysis or ### Content Details
* **Event E1:** Represented by a green hexagon on the left.
* **Vector Space (Left):** Located between Event E1 and the first layer of the DNN.
* **Input Layer:** A green column of 4 circles, representing the input layer of the DNN.
* **Deep Neural Network:** Consists of three gray columns of 4 circles each, representing the layers of the DNN. Each circle represents a neuron. The layers are fully connected, meaning each neuron in one layer is connected to every neuron in the next layer.
* **Association in DNNs:** The text "Association in DNNs" is located below the DNN, indicating that the DNN is used to model the association between the two events.
* **Pr(E2|E1):** The text "Pr(E2|E1)" represents the conditional probability of Event E2 occurring given that Event E1 has occurred. This is the output of the DNN.
* **Output Layer:** A red column of 4 circles, representing the output layer of the DNN.
* **Vector Space (Right):** Located between the last layer of the DNN and Event E2.
* **Event E2:** Represented by a red hexagon on the right.
### Key Observations
* The diagram illustrates a process where Event E1 is transformed into a vector representation, processed by a DNN, and then transformed back into Event E2.
* The DNN models the association between the two events, and the output is the conditional probability Pr(E2|E1).
* The color coding (green for E1, red for E2) visually distinguishes the input and output events.
### Interpretation
The diagram represents a system that uses a deep neural network to learn the relationship between two events, E1 and E2. The DNN takes a vector representation of E1 as input and outputs the probability of E2 occurring, given that E1 has occurred. This type of system could be used for various applications, such as predicting the outcome of an event based on the occurrence of another event, or for identifying patterns and relationships between events. The use of vector spaces allows for the representation of complex events in a format that can be processed by the DNN.