\n
## Bar Chart: Definition Attempts to Solve a Function
### Overview
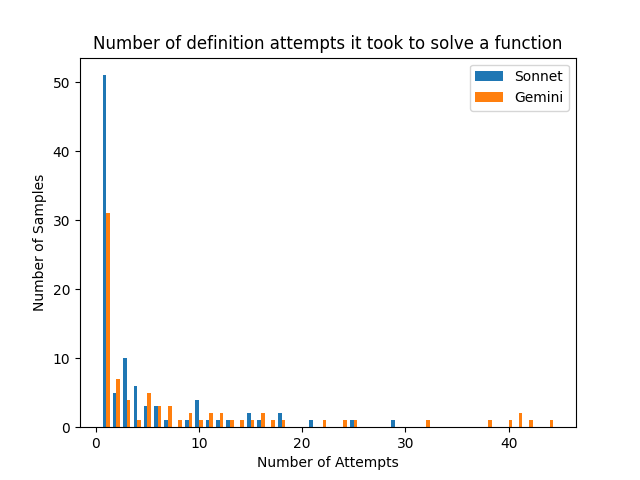
This bar chart visualizes the distribution of the number of attempts required for two models, "Sonnet" and "Gemini", to solve a function. The x-axis represents the number of attempts, and the y-axis represents the number of samples (frequency). The chart uses blue bars for Sonnet and orange bars for Gemini.
### Components/Axes
* **Title:** "Number of definition attempts it took to solve a function" (centered at the top)
* **X-axis Label:** "Number of Attempts" (centered at the bottom)
* **Y-axis Label:** "Number of Samples" (centered on the left)
* **X-axis Scale:** Ranges from 0 to approximately 45, with tick marks at intervals of 10.
* **Y-axis Scale:** Ranges from 0 to 50, with tick marks at intervals of 10.
* **Legend:** Located in the top-right corner.
* "Sonnet" - Blue
* "Gemini" - Orange
### Detailed Analysis
The chart displays histograms for both Sonnet and Gemini.
**Sonnet (Blue Bars):**
The Sonnet data shows a strong peak at 0 attempts, with a value of approximately 52 samples. The frequency decreases rapidly as the number of attempts increases. There are visible bars up to approximately 25 attempts, but their heights are significantly lower. The bars become sparse and short beyond 15 attempts.
* 0 Attempts: ~52 samples
* 1 Attempt: ~8 samples
* 2 Attempts: ~6 samples
* 3 Attempts: ~4 samples
* 4 Attempts: ~3 samples
* 5 Attempts: ~2 samples
* 6-9 Attempts: ~1-2 samples
* 10-25 Attempts: ~1 sample each
**Gemini (Orange Bars):**
The Gemini data also exhibits a peak at 0 attempts, with a value of approximately 8 samples. The distribution is broader than Sonnet's, with a more gradual decline in frequency as the number of attempts increases. There are visible bars up to approximately 45 attempts, though the heights are generally low.
* 0 Attempts: ~8 samples
* 1 Attempt: ~6 samples
* 2 Attempts: ~4 samples
* 3-5 Attempts: ~2-3 samples
* 6-10 Attempts: ~1-2 samples
* 11-45 Attempts: ~1 sample each
### Key Observations
* Both models perform best with 0 attempts, but Sonnet significantly outperforms Gemini in this category.
* Sonnet's distribution is more concentrated around lower attempt numbers, indicating it solves the function more quickly and consistently.
* Gemini has a wider distribution, suggesting it requires more attempts in some cases.
* The number of samples decreases rapidly for both models as the number of attempts increases.
### Interpretation
The data suggests that Sonnet is more efficient at solving the given function than Gemini. Sonnet requires fewer attempts to reach a solution in a larger proportion of cases. The difference in performance is most pronounced at 0 attempts, where Sonnet has a much higher frequency. Gemini, while still capable of solving the function, exhibits a broader range of attempt numbers, indicating greater variability in its performance. This could be due to differences in the underlying algorithms or training data used for each model. The chart provides a clear visual comparison of the efficiency of the two models in solving the function. The rapid decline in sample counts for higher attempt numbers for both models suggests that the function is relatively easy to solve, but that both models occasionally struggle.