## Bar Chart: Number of Definition Attempts to Solve a Function
### Overview
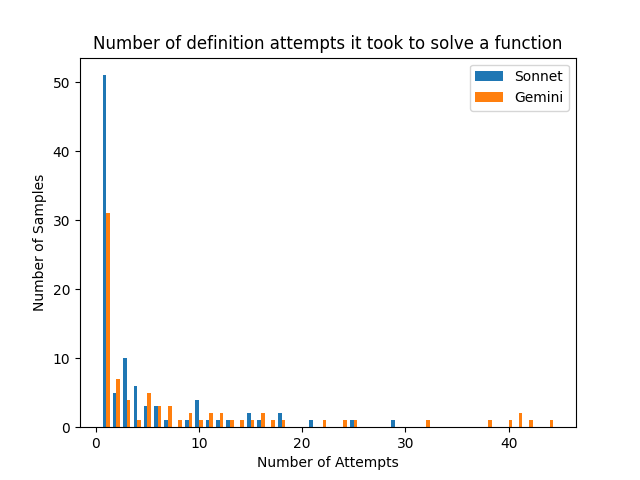
This is a grouped bar chart comparing the performance of two models, "Sonnet" and "Gemini," on a task involving solving a function. The chart displays the distribution of how many definition attempts were required for each model to successfully solve the function across a set of samples. The data is heavily right-skewed, with the vast majority of samples being solved in very few attempts.
### Components/Axes
* **Chart Title:** "Number of definition attempts it took to solve a function"
* **X-Axis:** Labeled "Number of Attempts". It is a linear scale with major tick marks at 0, 10, 20, 30, and 40. The axis represents discrete counts of attempts.
* **Y-Axis:** Labeled "Number of Samples". It is a linear scale with major tick marks at 0, 10, 20, 30, 40, and 50. The axis represents the frequency or count of function samples.
* **Legend:** Located in the top-right corner of the plot area.
* A blue square is labeled "Sonnet".
* An orange square is labeled "Gemini".
* **Data Series:** Two series of vertical bars, grouped by the "Number of Attempts" value on the x-axis. For each attempt count, the blue bar (Sonnet) is on the left, and the orange bar (Gemini) is on the right.
### Detailed Analysis
The following table reconstructs the approximate data from the chart. Values are estimated based on bar height relative to the y-axis grid. "N/A" indicates no visible bar for that model at that attempt count.
| Number of Attempts | Sonnet (Blue) - Approx. Number of Samples | Gemini (Orange) - Approx. Number of Samples |
| :--- | :--- | :--- |
| 1 | ~51 | ~31 |
| 2 | ~7 | ~5 |
| 3 | ~10 | ~3 |
| 4 | ~6 | ~4 |
| 5 | ~4 | ~5 |
| 6 | ~2 | ~3 |
| 7 | ~2 | ~2 |
| 8 | ~1 | ~2 |
| 9 | ~1 | ~1 |
| 10 | ~4 | ~1 |
| 11 | ~1 | ~2 |
| 12 | ~1 | ~1 |
| 13 | ~1 | ~1 |
| 14 | ~2 | ~1 |
| 15 | ~2 | ~1 |
| 16 | ~1 | N/A |
| 17 | ~2 | N/A |
| 18 | ~2 | N/A |
| 19 | N/A | N/A |
| 20 | ~1 | N/A |
| 21 | N/A | ~1 |
| 22 | N/A | N/A |
| 23 | N/A | N/A |
| 24 | N/A | ~1 |
| 25 | ~1 | ~1 |
| 26-28 | N/A | N/A |
| 29 | ~1 | N/A |
| 30-31 | N/A | N/A |
| 32 | N/A | ~1 |
| 33-37 | N/A | N/A |
| 38 | N/A | ~1 |
| 39 | N/A | N/A |
| 40 | N/A | ~1 |
| 41 | N/A | ~2 |
| 42 | N/A | N/A |
| 43 | N/A | ~1 |
| 44 | N/A | N/A |
**Trend Verification:**
* **Overall Trend:** Both distributions are extremely right-skewed. The highest frequency for both models is at 1 attempt, with a sharp, exponential-like decay as the number of attempts increases. A very long, sparse tail extends to over 40 attempts.
* **Sonnet (Blue) Trend:** Peaks dramatically at 1 attempt (~51 samples). The count drops sharply at 2 attempts, has a minor secondary peak at 3 attempts (~10), then generally declines with small fluctuations. The last visible data point is at 29 attempts.
* **Gemini (Orange) Trend:** Also peaks at 1 attempt (~31 samples), but this peak is lower than Sonnet's. It shows a more gradual initial decline than Sonnet. Notably, Gemini has several isolated data points in the high-attempt tail (21, 24, 32, 38, 40, 41, 43) where Sonnet has none, suggesting a subset of problems where Gemini required significantly more attempts.
### Key Observations
1. **Dominant First-Attempt Success:** For both models, the most common outcome by a large margin is solving the function in a single definition attempt. This accounts for the majority of all samples.
2. **Model Comparison at Low Attempts:** Sonnet has a higher absolute count of samples solved in 1 attempt (~51 vs. ~31). However, in the range of 2-9 attempts, the counts are more comparable, with Sonnet often slightly higher.
3. **Long Tail Discrepancy:** The most striking difference is in the tail. Gemini's distribution extends much further, with sparse but present data points beyond 30 attempts, including a small cluster around 40-41 attempts. Sonnet's data effectively ends before 30 attempts.
4. **Sparsity:** Beyond approximately 15 attempts, the data becomes very sparse for both models, with most attempt counts having zero or one sample.
### Interpretation
This chart visualizes the efficiency and reliability of two AI models (Sonnet and Gemini) on a specific function-solving task defined by "definition attempts."
* **Performance Implication:** The high concentration at 1 attempt suggests that for most function samples, both models can identify the correct solution path immediately. The task is likely straightforward for a majority of cases.
* **Model Differentiation:** The key differentiator is not typical performance but **failure mode or difficulty handling**. Sonnet appears more consistent; when it doesn't solve a problem immediately, it typically does so within a bounded number of attempts (<30). Gemini, while also efficient on most samples, exhibits a "long tail" behavior. This indicates that for a small subset of particularly challenging or anomalous function samples, Gemini can enter a prolonged, inefficient loop of definition attempts, far exceeding the range seen with Sonnet.
* **Practical Takeaway:** If the cost or time per attempt is significant, Sonnet might be preferable for its bounded worst-case behavior. Gemini's performance is excellent on average but carries a higher risk of extreme inefficiency on edge cases. The data suggests investigating the specific function samples that caused Gemini's long tail to understand the nature of the difficulty.
* **Uncertainty:** The exact numerical values are approximate due to the resolution of the chart. The interpretation of trends, however, is robust given the clear visual patterns.