# Technical Data Extraction: Control Effect Analysis (Layer 32)
This document provides a comprehensive extraction of data and trends from the provided image, which consists of eight line charts and one summary heatmap analyzing "Control effect (d)" across various target and affected axes at layer 32.
---
## 1. Component Isolation
The image is divided into two primary sections:
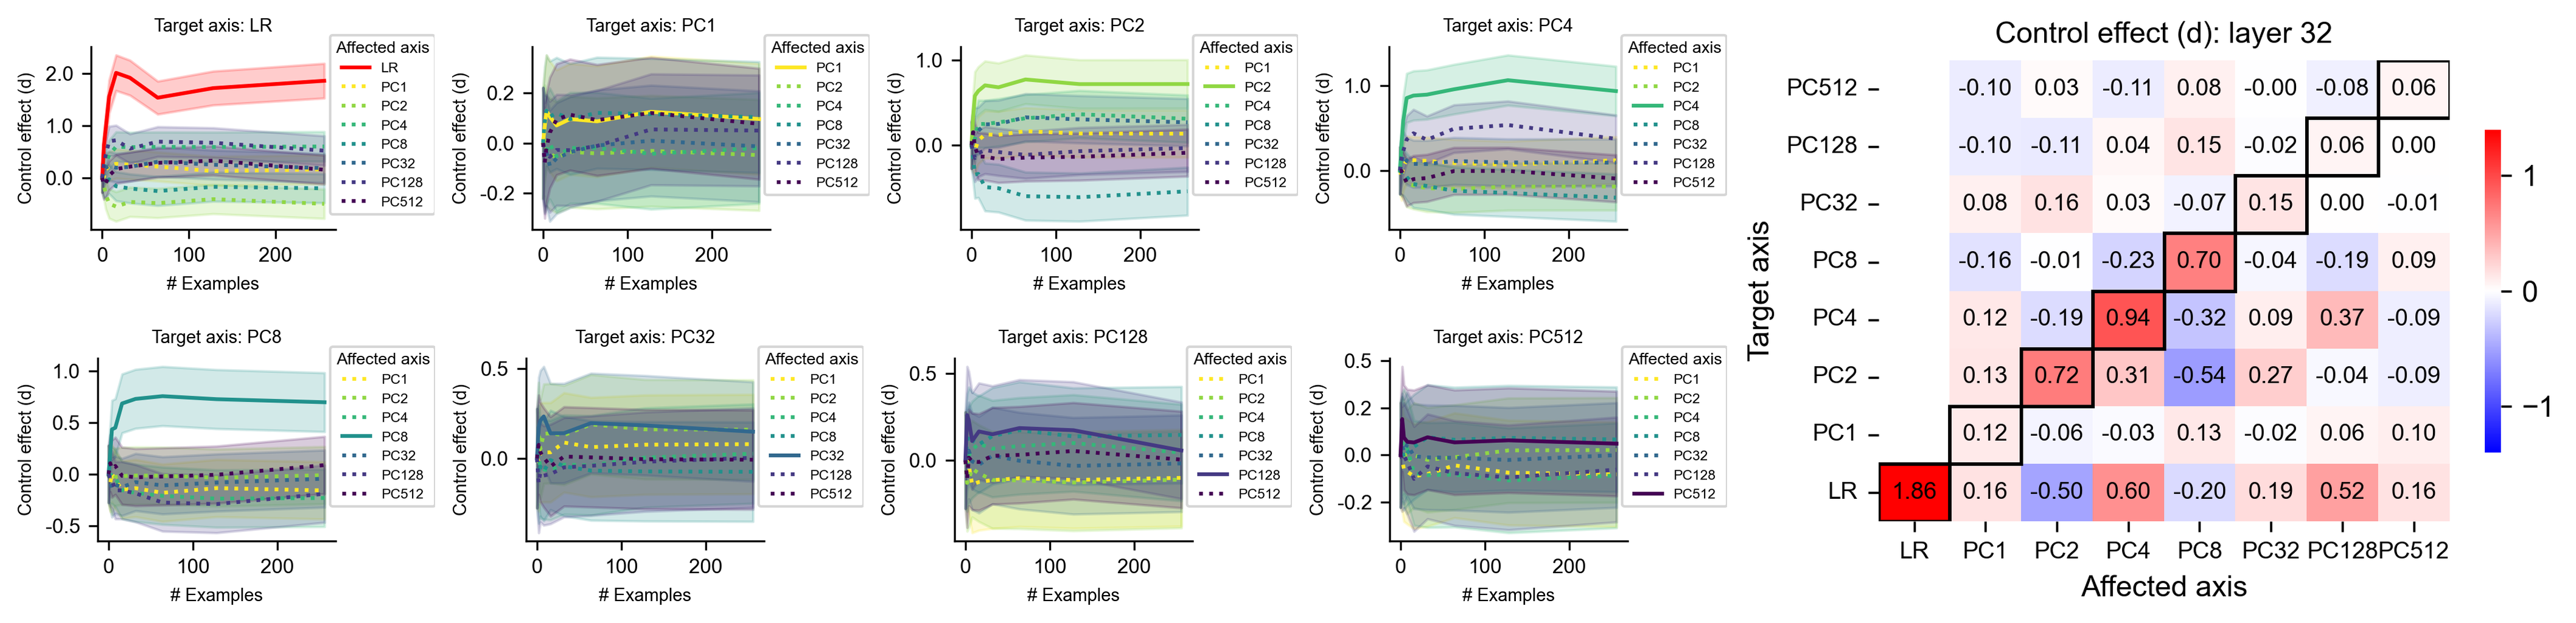
1. **Left/Center (Line Charts):** Eight individual plots showing the progression of the control effect as the number of examples increases (0 to 250).
2. **Right (Heatmap):** A summary matrix titled "Control effect (d): layer 32" showing the final or aggregate relationship between Target and Affected axes.
---
## 2. Summary Heatmap Data Extraction
**Title:** Control effect (d): layer 32
**Y-Axis (Target axis):** PC512, PC128, PC32, PC8, PC4, PC2, PC1, LR
**X-Axis (Affected axis):** LR, PC1, PC2, PC4, PC8, PC32, PC128, PC512
**Legend:** Color scale from -1 (Blue) to 0 (White) to +1 (Red).
### Data Table (Reconstructed)
The diagonal (outlined in black) represents the effect of a target axis on itself.
| Target \ Affected | LR | PC1 | PC2 | PC4 | PC8 | PC32 | PC128 | PC512 |
| :--- | :---: | :---: | :---: | :---: | :---: | :---: | :---: | :---: |
| **PC512** | -0.10 | 0.03 | -0.11 | 0.08 | -0.00 | -0.08 | 0.06 | N/A |
| **PC128** | -0.10 | -0.11 | 0.04 | 0.15 | -0.02 | 0.06 | 0.00 | N/A |
| **PC32** | 0.08 | 0.16 | 0.03 | -0.07 | 0.15 | 0.00 | -0.01 | N/A |
| **PC8** | -0.16 | -0.01 | -0.23 | **0.70** | -0.04 | -0.19 | 0.09 | N/A |
| **PC4** | 0.12 | -0.19 | **0.94** | -0.32 | 0.09 | 0.37 | -0.09 | N/A |
| **PC2** | 0.13 | **0.72** | 0.31 | -0.54 | 0.27 | -0.04 | -0.09 | N/A |
| **PC1** | **0.12** | -0.06 | -0.03 | 0.13 | -0.02 | 0.06 | 0.10 | N/A |
| **LR** | **1.86** | 0.16 | -0.50 | 0.60 | -0.20 | 0.19 | 0.52 | 0.16 |
*Note: The heatmap contains a black-bordered diagonal. The value for LR/LR is 1.86 (Strong Red). The value for PC4/PC2 is 0.94 (Red). The value for PC8/PC4 is 0.70 (Red).*
---
## 3. Line Chart Analysis (Target Axis Series)
Each chart shares the following attributes:
* **X-axis:** # Examples (Scale: 0, 100, 200)
* **Y-axis:** Control effect (d)
* **Legend (Affected axis):** LR (Solid Red), PC1 (Dotted Yellow), PC2 (Dotted Light Green), PC4 (Dotted Green), PC8 (Dotted Teal), PC32 (Dotted Blue-Grey), PC128 (Dotted Purple), PC512 (Dotted Dark Purple).
* **Visual Trend Logic:** In every chart, the line corresponding to the "Target axis" name (e.g., LR in the LR chart) is rendered as a **solid line** and typically shows the highest magnitude, while other "Affected axes" are dotted and cluster near zero.
### Chart 1: Target axis: LR
* **Trend:** The LR line (Solid Red) spikes sharply from 0 to ~2.0 within the first 25 examples, then stabilizes between 1.5 and 2.0.
* **Other axes:** All dotted lines remain clustered between -0.5 and 1.0, with PC128 (Purple) showing a slight upward trend toward 0.5.
### Chart 2: Target axis: PC1
* **Trend:** The PC1 line (Solid Yellow) rises quickly to ~0.1 and stays relatively flat.
* **Other axes:** Most axes are tightly clustered around 0.0. PC512 (Dark Purple) and PC128 (Purple) show the widest variance, fluctuating between -0.2 and 0.2.
### Chart 3: Target axis: PC2
* **Trend:** The PC2 line (Solid Light Green) rises to ~0.5 and stabilizes.
* **Other axes:** PC4 (Dotted Green) and PC1 (Dotted Yellow) stay near 0.2. PC512 (Dark Purple) stays below 0.
### Chart 4: Target axis: PC4
* **Trend:** The PC4 line (Solid Green) rises sharply to ~1.0 and stabilizes.
* **Other axes:** PC8 (Dotted Teal) and PC32 (Dotted Blue-Grey) remain near 0. PC512 (Dark Purple) shows a slight negative trend.
### Chart 5: Target axis: PC8
* **Trend:** The PC8 line (Solid Teal) rises to ~0.75 and stabilizes.
* **Other axes:** Clustered between -0.25 and 0.25.
### Chart 6: Target axis: PC32
* **Trend:** The PC32 line (Solid Blue-Grey) rises to ~0.2 and stabilizes.
* **Other axes:** High overlap; most lines are between -0.2 and 0.2.
### Chart 7: Target axis: PC128
* **Trend:** The PC128 line (Solid Purple) rises to ~0.2.
* **Other axes:** Significant variance; PC512 (Dark Purple) and PC32 (Blue-Grey) overlap heavily with the target axis.
### Chart 8: Target axis: PC512
* **Trend:** The PC512 line (Solid Dark Purple) rises to ~0.1.
* **Other axes:** All axes are very tightly clustered around the 0.0 to 0.1 range, indicating low specificity for this target.
---
## 4. Key Observations
1. **Specificity:** The "LR" (Logistic Regression) axis shows the strongest and most distinct control effect (d ≈ 1.86).
2. **Dimensionality Trend:** As the PC (Principal Component) number increases (from PC1 to PC512), the maximum control effect generally decreases and the separation between the target axis and other affected axes becomes less distinct.
3. **Stability:** In all cases, the control effect stabilizes rapidly, usually after 50-100 examples.