## Diagram: Process Flow with R1b Transformation
### Overview
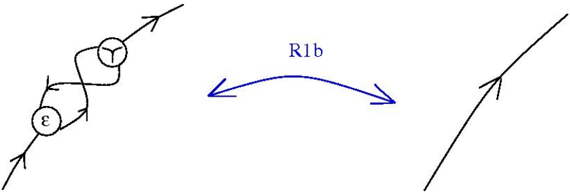
The diagram illustrates a two-part process flow. On the left, a complex cyclic structure with labeled nodes (ε and Y) is connected via directional arrows. On the right, a simplified linear pathway with a forked arrow is depicted. A blue bidirectional arrow labeled "R1b" bridges the two sections, suggesting a relationship or transformation between them.
### Components/Axes
- **Left Diagram**:
- **Nodes**:
- Circle labeled "ε" (epsilon) with inward-pointing arrows.
- Circle with a "Y" symbol (possibly representing a branching or decision point) with outward-pointing arrows.
- **Flow**:
- Arrows form a closed loop, indicating cyclical or recursive behavior.
- **Right Diagram**:
- **Pathway**:
- Straight line with a forked arrow at the end, suggesting divergence or branching.
- **Connecting Element**:
- Blue bidirectional arrow labeled "R1b" spans the gap between the left and right diagrams, implying a bidirectional relationship or transformation.
### Detailed Analysis
- **Left Diagram**:
- The "ε" node acts as a central hub with inward arrows, possibly representing accumulation or convergence.
- The "Y" node functions as a source or decision point, with arrows radiating outward, indicating divergence or branching.
- The cyclical loop suggests a feedback mechanism or iterative process.
- **Right Diagram**:
- The linear pathway with a forked arrow implies a progression toward a decision point or outcome.
- **R1b Arrow**:
- The bidirectional nature of "R1b" suggests a reversible or bidirectional interaction between the complex left structure and the simplified right pathway.
### Key Observations
1. The "R1b" label is the only textual element explicitly connecting the two diagrams, emphasizing its role as a critical link.
2. The left diagram’s cyclical structure contrasts with the right diagram’s linear pathway, highlighting a transformation from complexity to simplicity.
3. The "Y" symbol and forked arrow on the right may represent analogous concepts (e.g., branching in both cases), but their exact relationship requires further context.
### Interpretation
The diagram likely represents a scientific or technical process where a complex, cyclical system (left) undergoes a transformation mediated by "R1b" to produce a simpler, linear outcome (right). The "ε" node could symbolize a conserved quantity or energy state, while the "Y" node might represent a catalytic or decision-making step. The bidirectional "R1b" arrow implies that the transformation is not unidirectional, allowing for feedback or reversibility. This structure is common in fields like biochemistry (e.g., metabolic pathways), systems engineering, or decision-tree modeling, where complex interactions simplify into actionable outcomes.