## Mathematical Plot: Logarithmic Function Analysis
### Overview
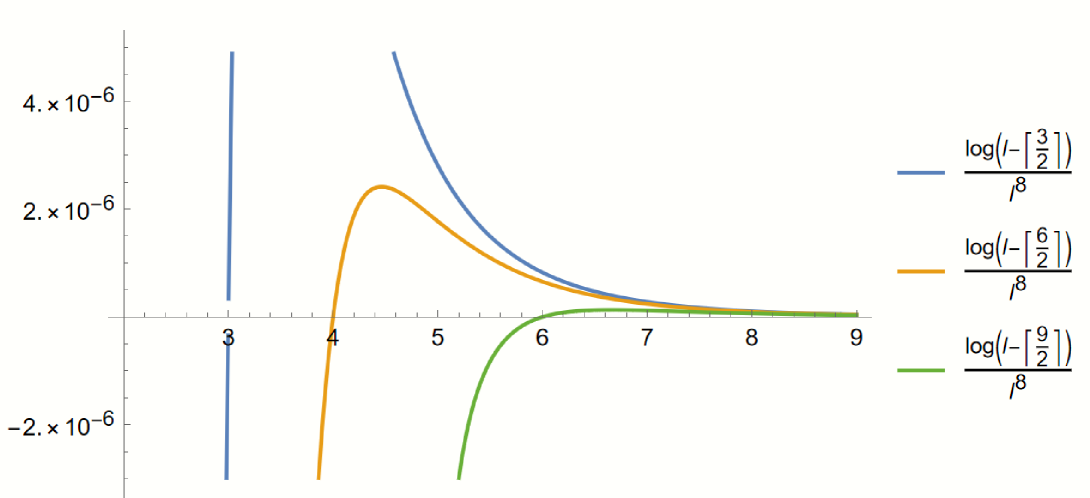
The image displays a mathematical plot featuring three distinct curves, each representing a variation of a logarithmic function divided by a power function. The plot is set against a white background with a standard Cartesian coordinate system. The x-axis ranges from 3 to 9, and the y-axis ranges from approximately $-2 \times 10^{-6}$ to $4 \times 10^{-6}$.
### Components/Axes
* **X-Axis:** Represents the variable $l$. The scale is linear, marked with integers from 3 to 9.
* **Y-Axis:** Represents the output value of the functions. The scale is in scientific notation, with major ticks at $-2 \times 10^{-6}$, $0$, $2 \times 10^{-6}$, and $4 \times 10^{-6}$.
* **Legend (Right side):** Lists the three functions plotted, color-coded to match the lines:
* **Blue Line:** $\frac{\log(l - [\frac{3}{2}])}{l^8}$
* **Orange Line:** $\frac{\log(l - [\frac{6}{2}])}{l^8}$
* **Green Line:** $\frac{\log(l - [\frac{9}{2}])}{l^8}$
*(Note: The variable $l$ is used in the expressions. The brackets $[\dots]$ denote the grouping of the fraction.)*