\n
## Mathematical Line Graph: Logarithmic Functions with Floor Operations
### Overview
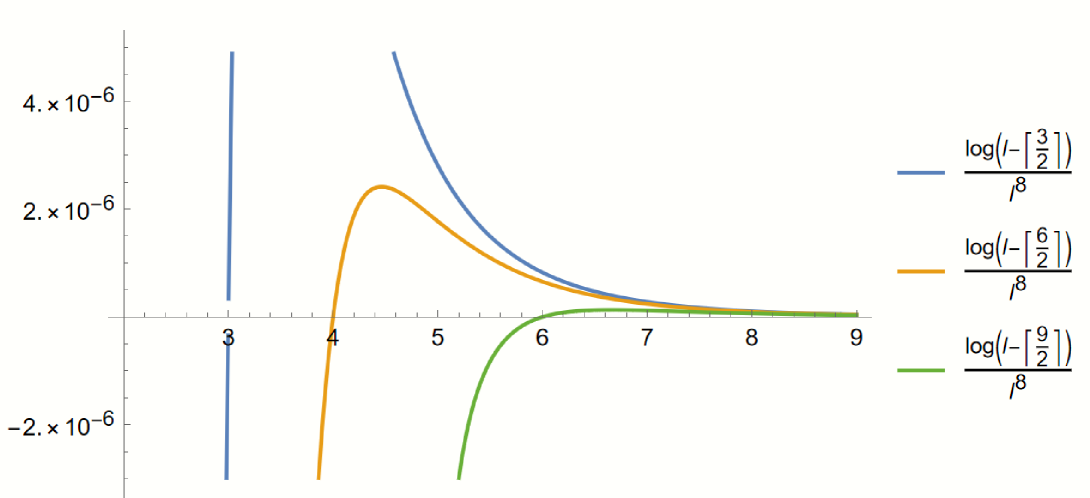
The image displays a mathematical line graph plotting three distinct functions against a common x-axis. The graph illustrates the behavior of functions involving logarithms and floor functions, scaled by a factor of \(j^8\). The curves exhibit different asymptotic behaviors and convergence patterns as the x-value increases.
### Components/Axes
- **X-Axis**: Linear scale ranging from 3 to 9, with major tick marks at integer intervals (3, 4, 5, 6, 7, 8, 9). No axis title is present.
- **Y-Axis**: Linear scale with values in scientific notation. Major tick marks are at:
- \(-2. \times 10^{-6}\)
- \(0\) (implied by the horizontal axis line)
- \(2. \times 10^{-6}\)
- \(4. \times 10^{-6}\)
No axis title is present.
- **Legend**: Positioned on the right side of the graph, vertically aligned. It contains three entries, each with a colored line segment and a corresponding mathematical expression:
1. **Blue Line**: \(\frac{\log\left(j - \left\lfloor \frac{3}{2} \right\rfloor\right)}{j^8}\)
2. **Orange Line**: \(\frac{\log\left(j - \left\lfloor \frac{6}{2} \right\rfloor\right)}{j^8}\)
3. **Green Line**: \(\frac{\log\left(j - \left\lfloor \frac{9}{2} \right\rfloor\right)}{j^8}\)
*Note: The floor function \(\lfloor x \rfloor\) denotes the greatest integer less than or equal to \(x\).*
### Detailed Analysis
**Trend Verification & Data Points:**
1. **Blue Curve** \(\left(\frac{\log(j - 1)}{j^8}\right)\):
* **Trend**: Exhibits a vertical asymptote near \(x = 3\). It descends very steeply from a high positive value, then transitions to a smooth, decreasing curve that approaches zero from above as \(x\) increases.
* **Key Points**:
* At \(x \approx 3\), the value is off the top of the chart (exceeds \(4. \times 10^{-6}\)).
* At \(x = 4\), \(y \approx 2.5 \times 10^{-6}\).
* At \(x = 5\), \(y \approx 1.0 \times 10^{-6}\).
* At \(x = 9\), \(y\) is very close to 0, approximately \(0.1 \times 10^{-6}\).
2. **Orange Curve** \(\left(\frac{\log(j - 3)}{j^8}\right)\):
* **Trend**: Starts from negative infinity near \(x = 4\) (vertical asymptote), rises sharply to a distinct maximum, then decreases smoothly, converging toward zero from above.
* **Key Points**:
* Vertical asymptote at \(x = 4\).
* Maximum value occurs at approximately \(x = 4.5\), with \(y \approx 2.4 \times 10^{-6}\).
* At \(x = 5\), \(y \approx 1.8 \times 10^{-6}\).
* At \(x = 6\), \(y \approx 0.6 \times 10^{-6}\).
* At \(x = 9\), \(y\) is very close to 0, nearly indistinguishable from the blue curve.
3. **Green Curve** \(\left(\frac{\log(j - 4)}{j^8}\right)\):
* **Trend**: Starts from negative infinity near \(x = 5\) (vertical asymptote), increases, crosses the x-axis, and then approaches zero from below, remaining negative.
* **Key Points**:
* Vertical asymptote at \(x = 5\).
* Crosses the x-axis (\(y=0\)) at approximately \(x = 6.0\).
* At \(x = 7\), \(y \approx -0.2 \times 10^{-6}\).
* At \(x = 9\), \(y\) is very close to 0 from the negative side, approximately \(-0.05 \times 10^{-6}\).
**Spatial Grounding & Convergence:**
- For \(x > 7\), all three curves converge tightly near the x-axis (\(y=0\)). The blue and orange curves approach from the positive side, while the green curve approaches from the negative side.
- The legend is placed in the right margin, with each label horizontally aligned with the tail end of its corresponding curve.
### Key Observations
1. **Asymptotic Behavior**: Each function has a vertical asymptote at a different integer value of \(x\) (3, 4, and 5 respectively), corresponding to the point where the argument of the logarithm becomes zero or negative.
2. **Domain Restriction**: The functions are only plotted for \(x\) values where the logarithm's argument is positive. For the blue curve, this is \(x > 3\); for orange, \(x > 4\); for green, \(x > 5\).
3. **Convergence**: Despite different starting points and initial behaviors, all three functions decay rapidly towards zero as \(x\) increases, due to the dominant \(j^8\) term in the denominator.
4. **Sign Difference**: The green curve is the only one that becomes and remains negative after crossing the x-axis, because \(\log(j-4)\) is negative for \(5 < j < 5\) (since \(j-4 < 1\)).
### Interpretation
This graph visualizes the comparative decay rates of three related mathematical functions. The core pattern is: **\(\frac{\log(j - c)}{j^8}\)**, where the constant \(c\) increases (1, 3, 4).
* **Effect of the Constant \(c\)**: Increasing \(c\) shifts the vertical asymptote to the right (to a higher \(x\) value) and delays the onset of the function's positive domain. It also changes the initial magnitude and sign of the function near its asymptote.
* **Dominance of the Denominator**: The \(j^8\) term in the denominator ensures that for sufficiently large \(j\) (here, \(j > 7\)), the logarithmic growth in the numerator is completely overwhelmed. This causes all functions to converge to zero, illustrating a powerful damping effect.
* **Mathematical Insight**: The graph demonstrates how a simple change in a parameter (\(c\)) within a function's definition can drastically alter its local behavior (position of asymptote, sign, initial peak) while leaving its long-term asymptotic behavior (convergence to zero) unchanged. This is a common theme in analysis and asymptotic theory.