## Data Table Comparison: Client A vs. Client B
### Overview
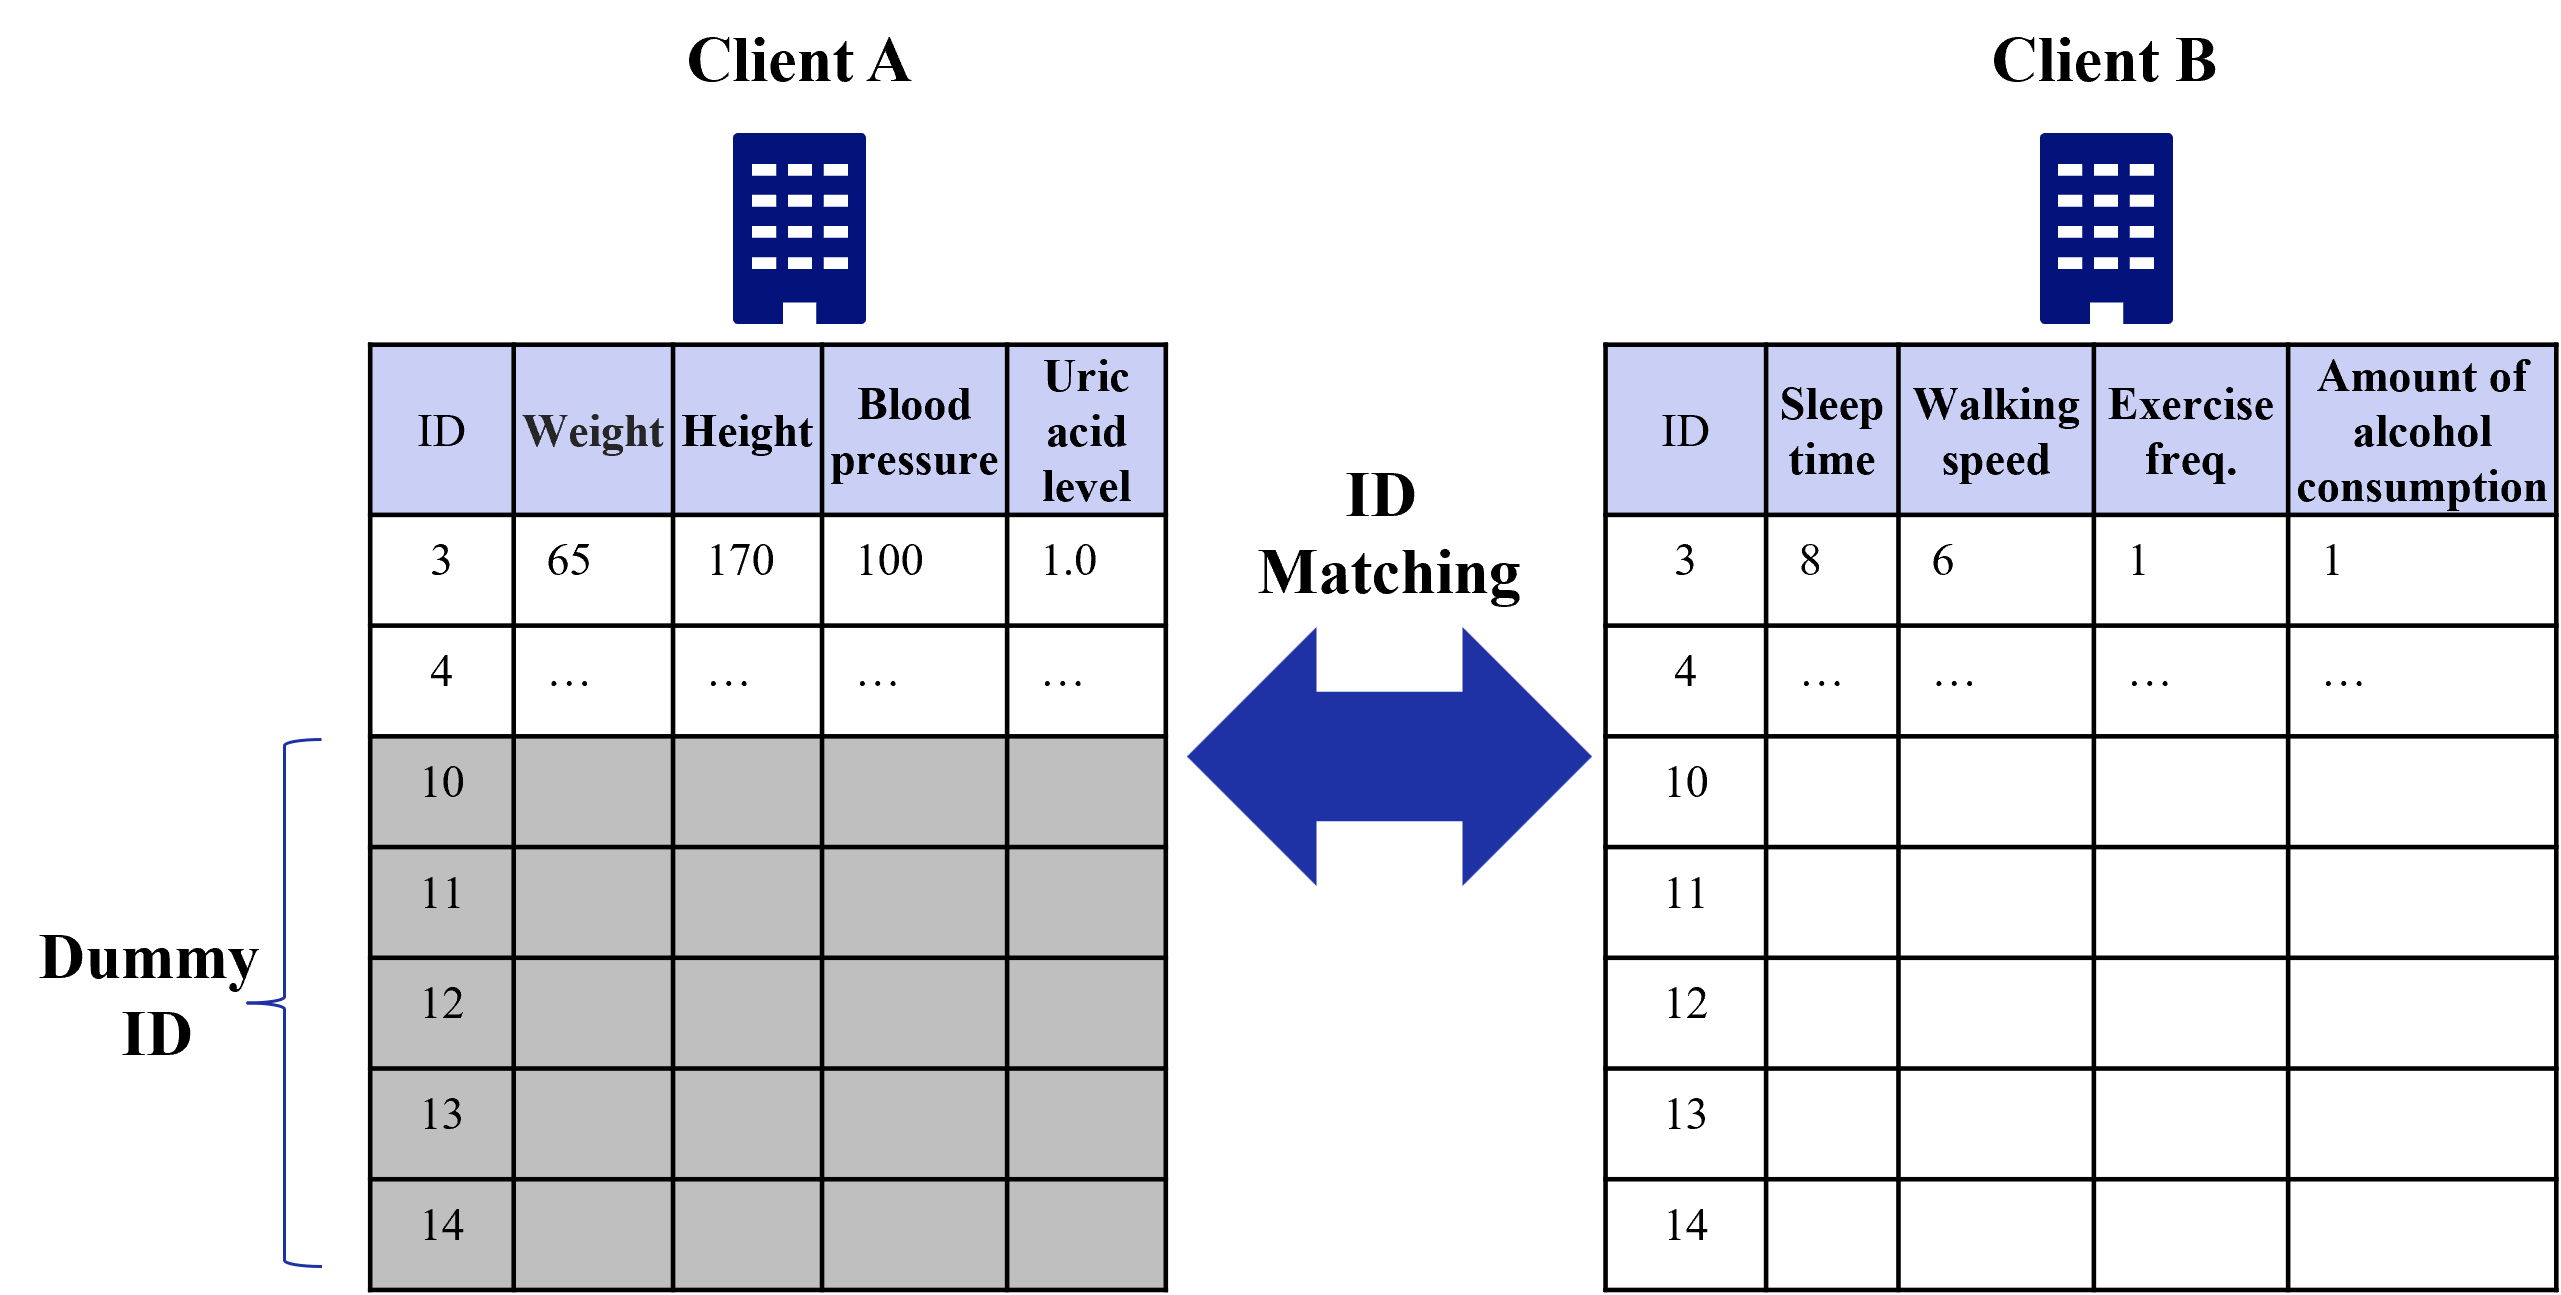
The image presents a comparison of data tables for two clients, Client A and Client B. Each table contains an ID column and several health-related metrics. The tables are linked by an "ID Matching" arrow, suggesting a comparison or correlation between the data. Some rows are filled with "..." indicating missing data, and some rows are grayed out and labeled as "Dummy ID".
### Components/Axes
* **Titles:** "Client A" (top-left), "Client B" (top-right), "ID Matching" (center)
* **Client A Table:**
* Columns: "ID", "Weight", "Height", "Blood pressure", "Uric acid level"
* Rows: ID values 3, 4, 10, 11, 12, 13, 14
* **Client B Table:**
* Columns: "ID", "Sleep time", "Walking speed", "Exercise freq.", "Amount of alcohol consumption"
* Rows: ID values 3, 4, 10, 11, 12, 13, 14
* **Dummy ID:** A bracket on the left side of the table indicates that IDs 10, 11, 12, 13, and 14 are "Dummy ID".
* **Arrow:** A large, dark blue, double-headed arrow points from the Client A table to the Client B table, labeled "ID Matching".
### Detailed Analysis or ### Content Details
**Client A Table:**
| ID | Weight | Height | Blood pressure | Uric acid level |
|---|---|---|---|---|
| 3 | 65 | 170 | 100 | 1.0 |
| 4 | ... | ... | ... | ... |
| 10 | | | | |
| 11 | | | | |
| 12 | | | | |
| 13 | | | | |
| 14 | | | | |
* ID 3: Weight = 65, Height = 170, Blood pressure = 100, Uric acid level = 1.0
* ID 4: All data is missing ("...")
* IDs 10-14: Data is missing (cells are empty and grayed out)
**Client B Table:**
| ID | Sleep time | Walking speed | Exercise freq. | Amount of alcohol consumption |
|---|---|---|---|---|
| 3 | 8 | 6 | 1 | 1 |
| 4 | ... | ... | ... | ... |
| 10 | | | | |
| 11 | | | | |
| 12 | | | | |
| 13 | | | | |
| 14 | | | | |
* ID 3: Sleep time = 8, Walking speed = 6, Exercise freq. = 1, Amount of alcohol consumption = 1
* ID 4: All data is missing ("...")
* IDs 10-14: Data is missing (cells are empty)
### Key Observations
* Data is only fully populated for ID 3 in both tables.
* Data for ID 4 is missing in both tables.
* IDs 10-14 are marked as "Dummy ID" and have no data.
* The "ID Matching" arrow suggests a relationship or comparison between the two datasets based on the ID.
### Interpretation
The image illustrates a scenario where health data is being compared between two clients based on a common ID. The presence of missing data ("...") and "Dummy ID" entries suggests that the dataset is incomplete or contains placeholder entries. The "ID Matching" arrow implies that the analysis aims to find correlations or patterns between the different health metrics recorded for each client. The limited data available makes it difficult to draw any concrete conclusions, but the structure indicates an intention to analyze the relationship between weight, height, blood pressure, uric acid level (Client A) and sleep time, walking speed, exercise frequency, and alcohol consumption (Client B).