## Diagram: Data Integration via ID Matching
### Overview
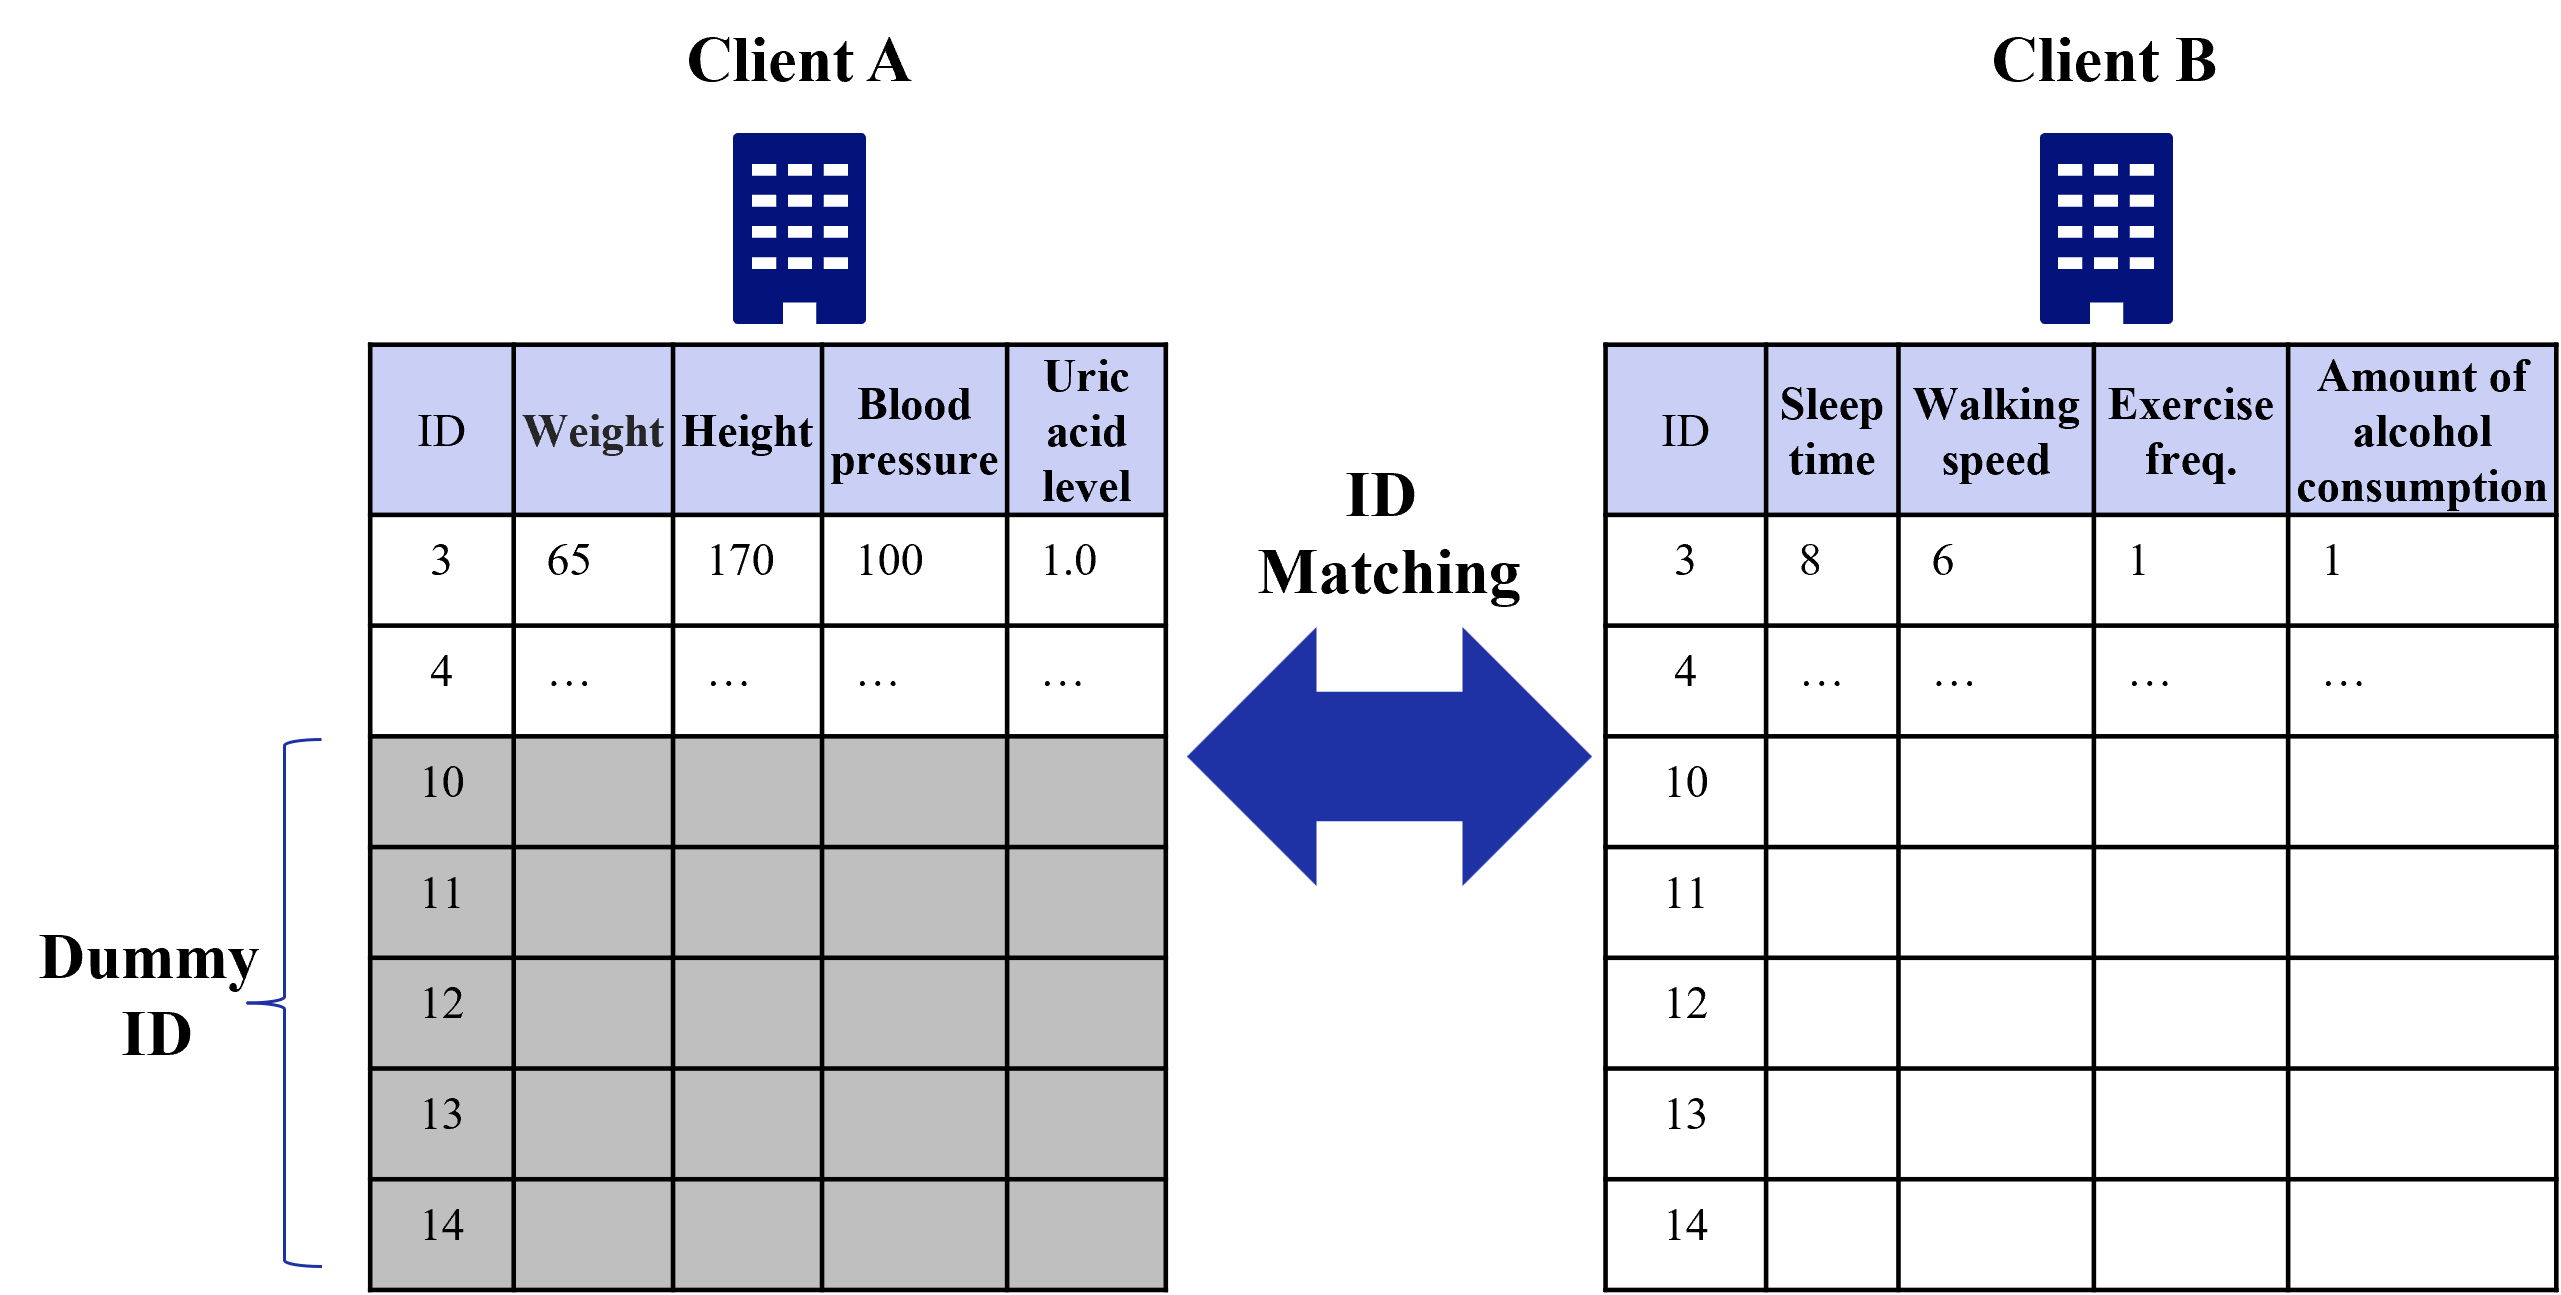
This diagram illustrates a conceptual data integration process between two distinct datasets, labeled "Client A" and "Client B." The diagram demonstrates how two separate tables, containing different categories of information, can be linked or joined using a shared identifier ("ID").
### Components/Axes
The diagram is composed of three primary sections arranged horizontally:
1. **Left Section (Client A):** A table representing health-related metrics.
2. **Center Section (Connection):** A large, blue, double-headed arrow labeled "ID Matching" indicating the relationship between the two tables.
3. **Right Section (Client B):** A table representing lifestyle-related metrics.
**Table Structures:**
* **Client A Table:** Contains 5 columns: `ID`, `Weight`, `Height`, `Blood pressure`, and `Uric acid level`.
* **Client B Table:** Contains 5 columns: `ID`, `Sleep time`, `Walking speed`, `Exercise freq.`, and `Amount of alcohol consumption`.
### Detailed Analysis
#### Client A Table (Left)
* **Header:** "Client A" with a building icon.
* **Data Rows:**
* **Row 1:** ID `3` | Weight `65` | Height `170` | Blood pressure `100` | Uric acid level `1.0`.
* **Row 2:** ID `4` | `...` (ellipses indicating omitted data) in all columns.
* **Rows 10-14:** These rows are shaded gray. They contain the IDs `10`, `11`, `12`, `13`, and `14` respectively, but the data cells are empty.
* **Annotation:** A blue bracket on the far left spans rows 10 through 14, labeled "Dummy ID."
#### ID Matching (Center)
* A large, blue, double-headed arrow is positioned between the two tables.
* The text "ID Matching" is centered above this arrow.
#### Client B Table (Right)
* **Header:** "Client B" with a building icon.
* **Data Rows:**
* **Row 1:** ID `3` | Sleep time `8` | Walking speed `6` | Exercise freq. `1` | Amount of alcohol consumption `1`.
* **Row 2:** ID `4` | `...` (ellipses indicating omitted data) in all columns.
* **Rows 10-14:** These rows are white (unshaded) and contain the IDs `10`, `11`, `12`, `13`, and `14` respectively, but the data cells are empty.
### Key Observations
* **Shared Key:** The "ID" column is the common denominator between both tables, serving as the primary key for the matching process.
* **Data Complementarity:** Client A tracks physiological metrics (Weight, Height, BP, Uric Acid), while Client B tracks lifestyle metrics (Sleep, Walking, Exercise, Alcohol).
* **Dummy Data:** The rows labeled "Dummy ID" (10-14) appear to be placeholders or synthetic records, likely used for testing database joins or anonymization protocols.
* **Visual Distinction:** The "Dummy ID" rows in Client A are shaded gray, whereas the corresponding rows in Client B are white, suggesting a visual distinction between the two datasets even when they share the same ID structure.
### Interpretation
This diagram represents a **Database Join operation** or **Data Enrichment process**.
* **The "Why":** The diagram demonstrates how an organization can combine disparate datasets—one containing physical health data and the other containing lifestyle data—to create a more comprehensive profile of an individual (e.g., "ID 3").
* **The "How":** By using the "ID" as a relational key, the system can merge the attributes from Client A and Client B.
* **Peircean Investigative Note:** The presence of "Dummy ID" rows suggests this is likely a schematic for a software development or data engineering environment. The use of ellipses (`...`) indicates that the dataset is larger than what is shown, implying this is a representative sample rather than the full dataset. The "ID Matching" arrow implies a bidirectional relationship or a synchronization process where data might be pulled from either side to complete the record.