\n
## Diagram: Data Integration via ID Matching
### Overview
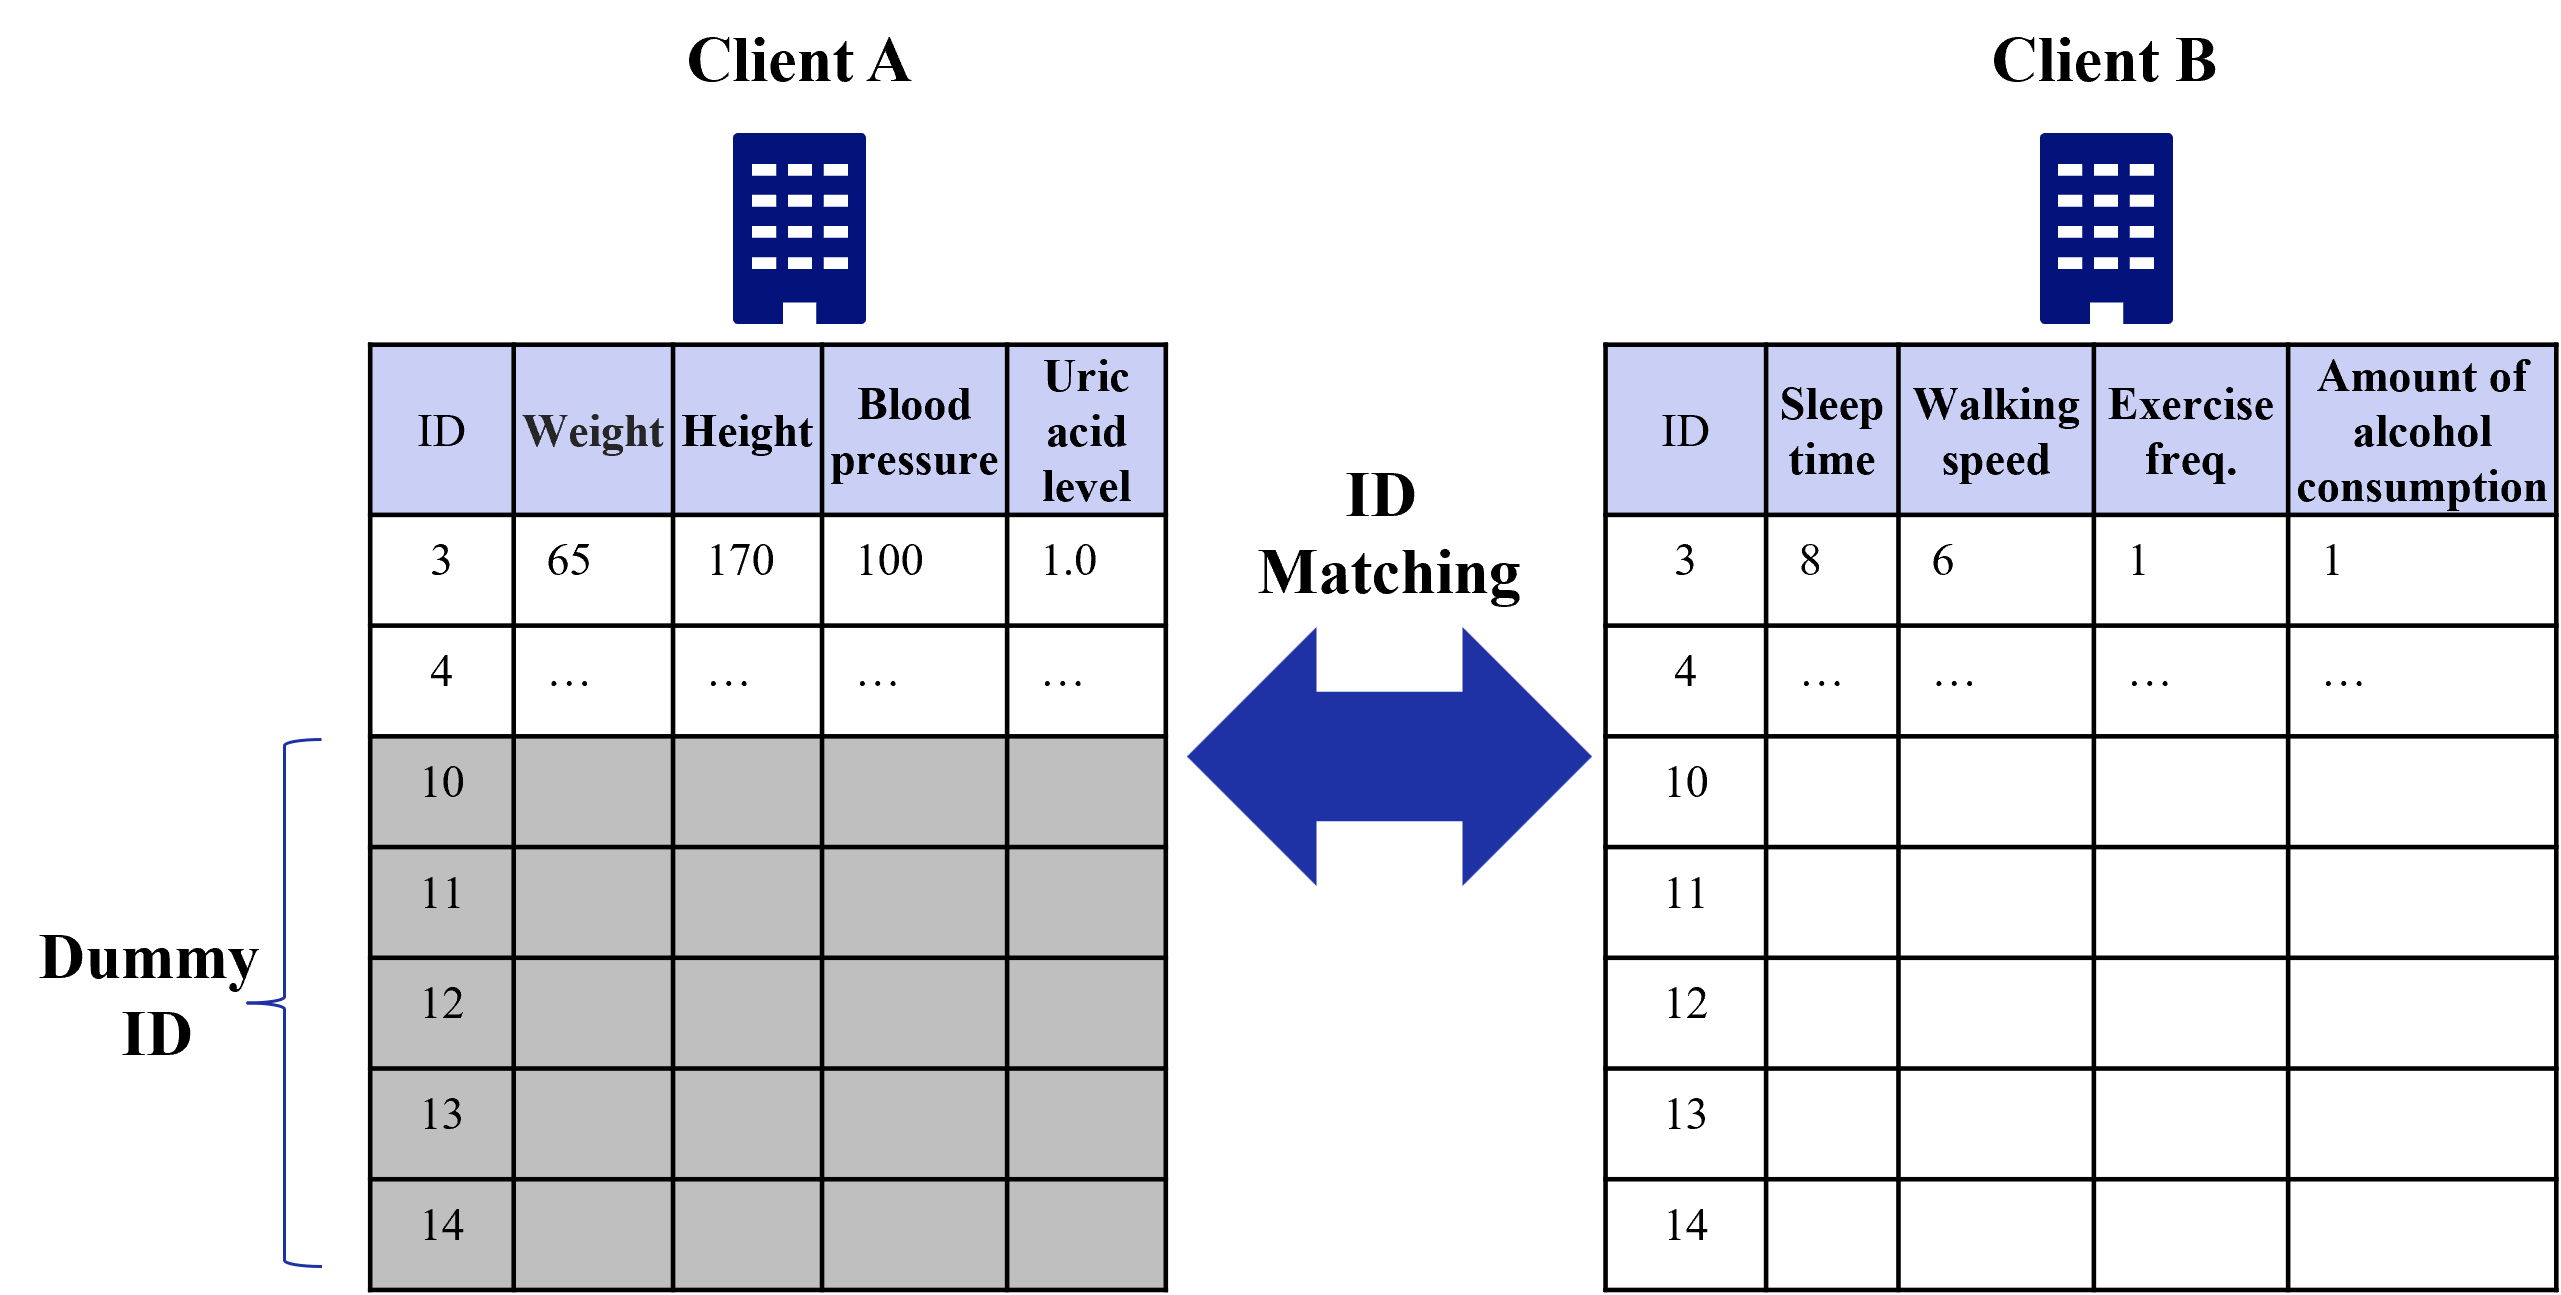
The image is a technical diagram illustrating a data matching process between two separate datasets, labeled "Client A" and "Client B." The core concept is linking records from these two sources using a common identifier (ID). The diagram visually represents the structure of the data tables and the matching operation.
### Components/Axes
The diagram consists of three main components arranged horizontally:
1. **Left Component (Client A):**
* **Header:** "Client A" with a blue building icon above a data table.
* **Table Structure:** A 5-column table with a light blue header row.
* **Column Headers (Left to Right):** `ID`, `Weight`, `Height`, `Blood pressure`, `Uric acid level`.
* **Data Rows:**
* Row 1: `3`, `65`, `170`, `100`, `1.0`
* Row 2: `4`, `...`, `...`, `...`, `...`
* Rows 3-7: IDs `10`, `11`, `12`, `13`, `14`. These rows are shaded gray.
* **Annotation:** A curly brace labeled **"Dummy ID"** points to the grayed-out rows (IDs 10-14).
2. **Central Component (Process):**
* A large, double-headed blue arrow pointing left and right.
* Text label above the arrow: **"ID Matching"**.
3. **Right Component (Client B):**
* **Header:** "Client B" with an identical blue building icon above a data table.
* **Table Structure:** A 5-column table with a light blue header row.
* **Column Headers (Left to Right):** `ID`, `Sleep time`, `Walking speed`, `Exercise freq.`, `Amount of alcohol consumption`.
* **Data Rows:**
* Row 1: `3`, `8`, `6`, `1`, `1`
* Row 2: `4`, `...`, `...`, `...`, `...`
* Rows 3-7: IDs `10`, `11`, `12`, `13`, `14`. These rows are empty (white background).
### Detailed Analysis
The diagram presents a snapshot of two datasets poised for integration.
* **Client A's Data:** Appears to contain biometric or health metrics (Weight, Height, Blood pressure, Uric acid level). The first record (ID 3) is fully populated. The second record (ID 4) is indicated as having data, but it is omitted (`...`). Records with IDs 10 through 14 are explicitly marked as "Dummy ID" and are visually distinguished with gray shading, suggesting they are placeholder, test, or non-active entries.
* **Client B's Data:** Appears to contain lifestyle or activity metrics (Sleep time, Walking speed, Exercise freq., Amount of alcohol consumption). The structure mirrors Client A: ID 3 is fully populated, ID 4 has omitted data (`...`), and IDs 10-14 are present but empty.
* **The Matching Process:** The central "ID Matching" arrow signifies an operation that will join or link rows from the two tables where the `ID` values correspond. For example, the record for ID 3 from Client A (biometrics) would be associated with the record for ID 3 from Client B (lifestyle data).
### Key Observations
1. **Common Key:** The `ID` column is the sole common field between the two datasets, serving as the primary key for the join operation.
2. **Data Completeness:** Only the first record (ID 3) in each table shows complete sample data. The second record (ID 4) implies existence but withholds details. The remaining records (IDs 10-14) are structurally present but contain no attribute data in this view.
3. **Dummy Data Designation:** The explicit "Dummy ID" label and gray shading for IDs 10-14 in Client A's table is a critical annotation. It indicates these entries are not genuine records, which is important for understanding data quality or the scope of a real matching exercise.
4. **Symmetry and Asymmetry:** The tables are symmetric in structure (5 columns each, same ID list) but asymmetric in content (different attribute columns) and visual treatment (gray vs. white background for dummy rows).
### Interpretation
This diagram is a conceptual model for **data fusion or entity resolution**. It demonstrates how disparate data sources (Client A and Client B), which hold different attributes about the same set of entities (identified by `ID`), can be integrated.
* **Purpose:** The likely goal is to create a unified profile for each ID by combining biometric data from one source with lifestyle data from another. This is a common pattern in healthcare analytics, customer 360 platforms, or research studies.
* **Relationship:** The bidirectional arrow suggests the matching process is mutual or that the relationship can be queried from either side. It doesn't imply directionality of data flow.
* **Notable Implications:**
* The presence of "Dummy ID" entries highlights a common real-world data issue: the need to handle placeholder or test records during integration to avoid corrupting analysis.
* The omitted data (`...`) for ID 4 suggests the diagram is a simplified example, focusing on the structure and process rather than exhaustive data.
* The successful match for ID 3 implies that for this entity, a complete, multi-dimensional dataset (biometrics + lifestyle) can be constructed, enabling richer analysis (e.g., correlating sleep time with blood pressure).
In essence, the image communicates the **architecture of a data join operation**, emphasizing the role of a common identifier and the careful handling of different data types and record statuses.