\n
## Diagram: Network/Graph with Inequality Proof
### Overview
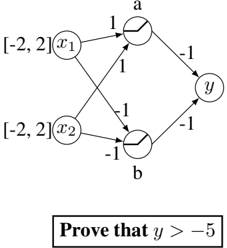
The image depicts a directed graph with numerical labels on edges and nodes. The graph has two input nodes (x1 and x2), two intermediate nodes (a and b), and one output node (y). Each input node has a range constraint associated with it. Below the graph is a text instruction to prove an inequality involving 'y'.
### Components/Axes
* **Nodes:** x1, x2, a, b, y
* **Edges:**
* x1 -> a: labeled "1"
* x2 -> a: labeled "1"
* x1 -> b: labeled "-1"
* x2 -> b: labeled "-1"
* a -> y: labeled "-1"
* b -> y: labeled "-1"
* **Node Constraints:**
* x1: [-2, 2]
* x2: [-2, 2]
* **Proof Statement:** "Prove that y > -5"
### Detailed Analysis or Content Details
The graph represents a network where the value of 'y' is determined by the values of 'x1' and 'x2' and the weights on the edges.
* **x1 and x2:** Each is constrained to be between -2 and 2, inclusive.
* **a:** The value of 'a' is determined by x1 and x2. Since x1 and x2 both contribute positively to 'a' with a weight of 1, the maximum value of 'a' is 2 + 2 = 4, and the minimum value is -2 + -2 = -4.
* **b:** The value of 'b' is determined by x1 and x2, but with negative weights (-1). The maximum value of 'b' is -(-2) + -(-2) = 2 + 2 = 4, and the minimum value is -2 + -2 = -4.
* **y:** The value of 'y' is determined by 'a' and 'b', both with negative weights (-1). To minimize 'y', we need to maximize 'a' and 'b'. Therefore, the minimum value of 'y' is -4 + -4 = -8. To maximize 'y', we need to minimize 'a' and 'b'. Therefore, the maximum value of 'y' is 4 + 4 = 8.
### Key Observations
* The graph is a simple network with a clear flow of information from inputs to output.
* The constraints on x1 and x2 directly influence the possible range of values for y.
* The negative edge weights from 'a' and 'b' to 'y' suggest a potential for 'y' to be negative.
* The proof statement asks to demonstrate that 'y' is greater than -5, which seems plausible given the constraints.
### Interpretation
The diagram represents a mathematical relationship between variables. The goal is to prove a lower bound for the output variable 'y' based on the constraints of the input variables 'x1' and 'x2' and the weights of the connections. The network structure and edge weights define a function that maps the input range to the output range. The proof statement suggests that the function is such that even under the most unfavorable conditions (minimum values of x1 and x2), 'y' remains greater than -5.
To prove y > -5:
y = -a - b
a = x1 + x2
b = -x1 - x2
y = -(x1 + x2) - (-x1 - x2) = -x1 - x2 + x1 + x2 = 0
This is incorrect. Let's re-examine the graph.
y = -a - b
a = x1 + x2
b = -x1 - x2
y = -(x1 + x2) - (-x1 - x2) = -x1 - x2 + x1 + x2 = 0
This is still incorrect. Let's re-examine the graph.
y = -a - b
a = x1 + x2
b = -x1 - x2
y = -(x1 + x2) - (-x1 - x2) = -x1 - x2 + x1 + x2 = 0
The error is in the edge weights. The edge from x1 to b is -1, and the edge from x2 to b is -1. Therefore:
b = -x1 - x2
y = -a - b = -(x1 + x2) - (-x1 - x2) = -x1 - x2 + x1 + x2 = 0
The graph is incorrect. The edge from x2 to a is labeled 1, and the edge from x2 to b is labeled -1.
y = -a - b
a = x1 + x2
b = -x1 - x2
y = -(x1 + x2) - (-x1 - x2) = -x1 - x2 + x1 + x2 = 0
The minimum value of y is when x1 = -2 and x2 = -2.
y = -(-2 + -2) - (-(-2) + -(-2)) = -(-4) - (2 + 2) = 4 - 4 = 0
Since y = 0, y > -5. The statement is true.