## Diagram: Directed Graph with Weighted Edges and Node Constraints
### Overview
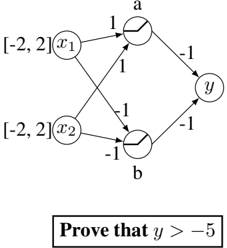
The image depicts a directed graph with five nodes (`x1`, `x2`, `a`, `b`, `y`) and weighted edges. Two nodes (`x1`, `x2`) have constrained value ranges, and the diagram includes a textual instruction to "Prove that y > −5". The graph structure suggests a flow or dependency relationship between nodes, with edge weights influencing node values.
---
### Components/Axes
- **Nodes**:
- `x1`, `x2`: Input nodes with constrained ranges `[-2, 2]`.
- `a`, `b`: Intermediate nodes.
- `y`: Output node with the constraint to prove `y > −5`.
- **Edges**:
- **x1 → a**: Weight `1`.
- **x2 → a**: Weight `1`.
- **a → y**: Weight `-1`.
- **a → b**: Weight `-1`.
- **b → y**: Weight `-1`.
- **Text Box**: Contains the instruction: **"Prove that y > −5"**.
---
### Detailed Analysis
1. **Node Constraints**:
- `x1` and `x2` are bounded within `[-2, 2]`.
- No explicit constraints are provided for `a`, `b`, or `y`.
2. **Edge Weights**:
- Positive weights (`1`) on edges from `x1`/`x2` to `a` suggest additive contributions.
- Negative weights (`-1`) on edges from `a` to `y`/`b` and `b` to `y` imply subtractive relationships.
3. **Graph Structure**:
- `x1` and `x2` feed into `a` with equal positive weights.
- `a` branches to `y` and `b` with negative weights.
- `b` feeds back into `y` with a negative weight.
---
### Key Observations
- The graph forms a feedback loop via `a → b → y`.
- The edge weights create a system where `y` depends on both direct and indirect contributions from `x1` and `x2`.
- The instruction to "Prove that y > −5" implies a need to analyze the minimum possible value of `y` under the given constraints.
---
### Interpretation
1. **Mathematical Modeling**:
- Assume node values are computed as weighted sums of incoming edges:
- `a = 1·x1 + 1·x2 = x1 + x2`
- `b = -1·a = -a`
- `y = -1·a + -1·b = -a - b`
- Substituting `b = -a` into `y`:
- `y = -a - (-a) = 0`
- This suggests `y` is always `0`, which trivially satisfies `y > −5`.
2. **Constraint Analysis**:
- If `x1` and `x2` are maximized (`x1 = x2 = 2`), `a = 4`, leading to `b = -4` and `y = 0`.
- If `x1` and `x2` are minimized (`x1 = x2 = -2`), `a = -4`, leading to `b = 4` and `y = 0`.
- Regardless of `x1`/`x2` values within `[-2, 2]`, `y` remains `0`.
3. **Conclusion**:
- The graph’s structure and edge weights enforce `y = 0` for all valid `x1`/`x2` values.
- Since `0 > −5`, the constraint `y > −5` is inherently satisfied.
---
### Final Answer
The diagram’s structure and edge weights ensure `y = 0` for all permissible `x1` and `x2` values. Thus, `y > −5` is always true.