\n
## Comparative Pie Charts: Building Energy Use (1990 vs. 2000)
### Overview
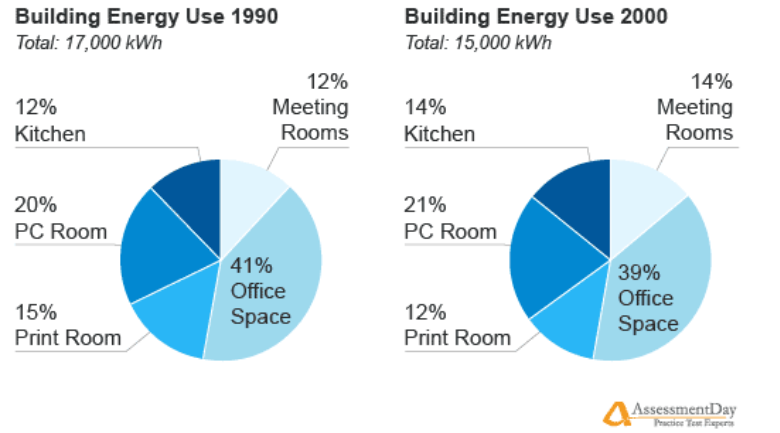
The image displays two pie charts side-by-side, comparing the percentage distribution of energy consumption across five different functional areas within a building for the years 1990 and 2000. The total annual energy use for the building is provided for each year.
### Components/Axes
* **Chart Type:** Two pie charts.
* **Titles:**
* Left Chart: "Building Energy Use 1990"
* Right Chart: "Building Energy Use 2000"
* **Total Values:**
* 1990: "Total: 17,000 kWh"
* 2000: "Total: 15,000 kWh"
* **Categories (Slices):** The same five categories are present in both charts, each represented by a distinct shade of blue.
* **Kitchen** (Darkest Blue)
* **Meeting Rooms** (Lightest Blue)
* **PC Room** (Medium-Dark Blue)
* **Office Space** (Medium-Light Blue)
* **Print Room** (Medium Blue)
* **Labels:** Each slice is labeled with its category name and percentage value. Labels are connected to their respective slices with thin lines.
* **Legend/Key:** The category names and their associated colors are defined by the labels directly on the chart slices; there is no separate legend box.
* **Source/Logo:** A logo for "AssessmentDay" with the tagline "Practice Test Experts" is present in the bottom-right corner.
### Detailed Analysis
**1990 Chart (Total: 17,000 kWh)**
* **Office Space:** 41% (Largest slice, located in the bottom-right quadrant).
* **PC Room:** 20% (Second-largest slice, located in the left half).
* **Print Room:** 15% (Located in the bottom-left quadrant).
* **Kitchen:** 12% (Located in the top-left quadrant).
* **Meeting Rooms:** 12% (Located in the top-right quadrant).
**2000 Chart (Total: 15,000 kWh)**
* **Office Space:** 39% (Remains the largest slice, located in the bottom-right quadrant).
* **PC Room:** 21% (Second-largest slice, located in the left half).
* **Kitchen:** 14% (Located in the top-left quadrant).
* **Meeting Rooms:** 14% (Located in the top-right quadrant).
* **Print Room:** 12% (Located in the bottom-left quadrant).
**Trend Verification (1990 to 2000):**
* **Office Space:** Percentage decreased by 2 percentage points (41% → 39%).
* **PC Room:** Percentage increased by 1 percentage point (20% → 21%).
* **Print Room:** Percentage decreased by 3 percentage points (15% → 12%).
* **Kitchen:** Percentage increased by 2 percentage points (12% → 14%).
* **Meeting Rooms:** Percentage increased by 2 percentage points (12% → 14%).
* **Total Energy Use:** Decreased by 2,000 kWh (17,000 → 15,000), an approximate 11.8% reduction.
### Key Observations
1. **Overall Reduction:** The building's total energy consumption decreased significantly (by ~11.8%) over the decade.
2. **Shift in Distribution:** While "Office Space" remained the largest consumer, its dominance slightly diminished. The proportional shares of "Kitchen" and "Meeting Rooms" grew equally.
3. **Print Room Decline:** The "Print Room" saw the largest proportional decrease, which may correlate with technological changes (e.g., reduced printing needs, more efficient printers).
4. **PC Room Stability:** The "PC Room" share remained relatively stable, increasing only slightly, suggesting its energy demand grew roughly in line with the building's average efficiency changes.
### Interpretation
The data suggests a building undergoing a transition in both efficiency and function between 1990 and 2000. The **absolute reduction in total energy use (from 17,000 to 15,000 kWh)** is the most significant finding, indicating successful energy conservation measures or a reduction in overall building activity.
The **changing percentages** reveal a shift in internal energy priorities. The rise in proportional use for "Kitchen" and "Meeting Rooms" could indicate increased catering, more collaborative work, or the addition of appliances. The relative stability of the "PC Room" suggests computing became a consistent, baseline load. The notable drop in the "Print Room's" share is a strong candidate for a primary driver of the overall efficiency gain, potentially reflecting the early digital transformation of office workflows.
In essence, the charts depict a building becoming more energy-efficient overall, while its internal energy profile slowly shifts away from centralized printing and towards spaces associated with sustenance (Kitchen) and collaboration (Meeting Rooms).