## Heatmap: Parameter Space Analysis
### Overview
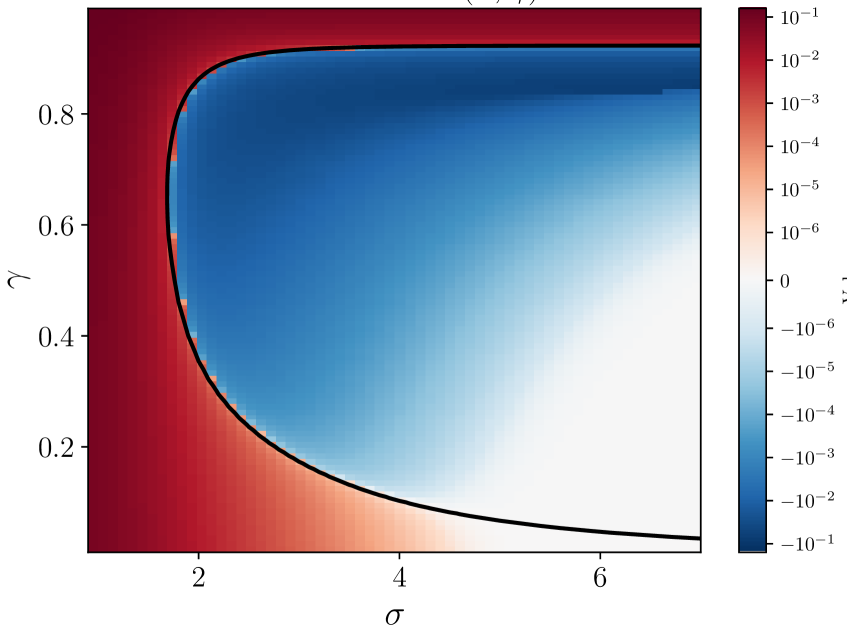
The image depicts a two-dimensional heatmap visualizing a parameter space defined by variables γ (vertical axis) and σ (horizontal axis). The color gradient transitions from red (positive values) to blue (negative values), with a black boundary curve separating distinct regions. A logarithmic color scale on the right quantifies the magnitude of the values.
### Components/Axes
- **Vertical Axis (γ)**: Labeled with values 0.2, 0.4, 0.6, 0.8, increasing upward.
- **Horizontal Axis (σ)**: Labeled with values 2, 4, 6, increasing rightward.
- **Color Scale**:
- Red (10⁻¹ to 10⁻³) → Orange (10⁻⁴) → Yellow (10⁻⁵) → White (0) → Blue (-10⁻⁵ to -10⁻¹).
- Positioned on the right, vertically aligned.
- **Boundary Curve**: A smooth, concave black curve separating red (positive) and blue (negative) regions. It originates near (σ=2, γ=0.2) and curves upward to intersect the γ-axis near γ=0.8.
### Detailed Analysis
1. **Red Region (Positive Values)**:
- Dominates the lower-left quadrant (σ < 4, γ < 0.6).
- Intensity decreases from dark red (10⁻¹) near σ=2, γ=0.2 to lighter red/orange (10⁻³–10⁻⁴) as σ and γ increase.
- Gradual transition to white near the boundary curve.
2. **Blue Region (Negative Values)**:
- Occupies the upper-right quadrant (σ > 4, γ > 0.6).
- Intensity increases from light blue (-10⁻⁵) near the curve to dark blue (-10⁻¹) at σ=6, γ=0.8.
- Sharp contrast with the red region, indicating a sign change across the boundary.
3. **Boundary Curve**:
- Separates positive (red) and negative (blue) regions.
- Follows a concave shape, suggesting a nonlinear relationship between γ and σ.
- Positioned closer to the σ-axis at lower γ values and shifts upward as σ increases.
### Key Observations
- **Threshold Behavior**: The black curve acts as a decision boundary, demarcating regions of opposing signs.
- **Magnitude Gradient**: Values transition smoothly from extreme magnitudes (10⁻¹) to near-zero (white) near the boundary.
- **Asymmetry**: The red region is more concentrated in the lower σ/γ range, while the blue region dominates higher σ/γ values.
### Interpretation
The heatmap likely represents a function \( f(\gamma, \sigma) \) with critical behavior at the black boundary curve. The red and blue regions suggest opposing phenomena (e.g., stability vs. instability, activation vs. suppression) depending on parameter combinations. The logarithmic scale emphasizes sensitivity to small changes in magnitude, particularly near the boundary. The concave curve implies a nonlinear interaction between γ and σ, potentially indicating a phase transition or bifurcation in the modeled system. The asymmetry in region distribution highlights that higher σ values disproportionately influence the sign change, while γ modulates the transition's steepness.