## Histogram: Token Distribution in Questions and Answers
### Overview
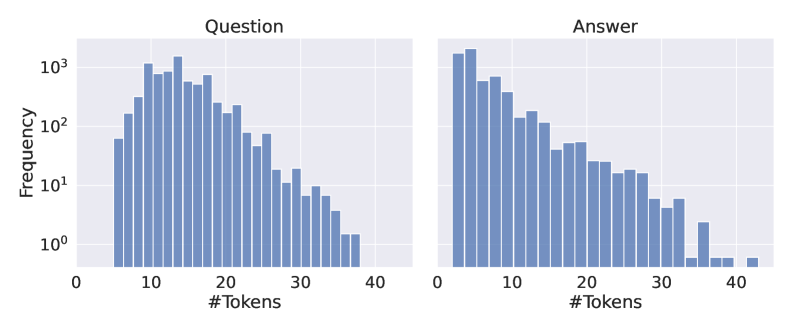
The image presents two histograms side-by-side, displaying the distribution of the number of tokens in "Question" and "Answer" texts. The y-axis (Frequency) is on a logarithmic scale, ranging from 10^0 to 10^3. The x-axis (#Tokens) represents the number of tokens, ranging from 0 to 40. Both histograms use blue bars to represent the frequency of each token count.
### Components/Axes
* **Titles:** "Question" (left histogram), "Answer" (right histogram)
* **X-axis:** "#Tokens" (both histograms), ranging from 0 to 40 in increments of 10.
* **Y-axis:** "Frequency" (both histograms), logarithmic scale from 10^0 (1) to 10^3 (1000).
* **Bars:** Blue bars representing the frequency of each token count.
### Detailed Analysis
**Question Histogram:**
* The distribution is unimodal and skewed to the right.
* The frequency increases from 0 tokens to a peak around 10-15 tokens.
* The frequency then decreases gradually as the number of tokens increases towards 40.
* Approximate values:
* 5 tokens: Frequency ~ 50
* 10 tokens: Frequency ~ 800
* 15 tokens: Frequency ~ 1000
* 20 tokens: Frequency ~ 500
* 25 tokens: Frequency ~ 200
* 30 tokens: Frequency ~ 50
* 35 tokens: Frequency ~ 10
* 40 tokens: Frequency ~ 2
**Answer Histogram:**
* The distribution is unimodal and skewed to the right, similar to the question histogram.
* The frequency peaks at a lower token count compared to the question histogram.
* The frequency decreases more rapidly as the number of tokens increases.
* Approximate values:
* 5 tokens: Frequency ~ 1200
* 10 tokens: Frequency ~ 600
* 15 tokens: Frequency ~ 300
* 20 tokens: Frequency ~ 150
* 25 tokens: Frequency ~ 75
* 30 tokens: Frequency ~ 30
* 35 tokens: Frequency ~ 5
* 40 tokens: Frequency ~ 2
### Key Observations
* Both questions and answers have a right-skewed distribution of token counts.
* Answers tend to have fewer tokens than questions, as the peak frequency occurs at a lower token count in the answer histogram.
* The frequency of questions with a higher number of tokens is greater than the frequency of answers with a higher number of tokens.
### Interpretation
The histograms suggest that, on average, answers are shorter than questions in terms of the number of tokens. The right-skewed distribution indicates that while most questions and answers have a relatively small number of tokens, there is a tail of longer questions and answers. The difference in the peak location and the rate of frequency decrease suggests that longer questions are more common than longer answers. This could be due to the nature of the data, where questions often require more context or detail than the corresponding answers.