\n
## Histograms: Token Frequency Distribution for Question and Answer
### Overview
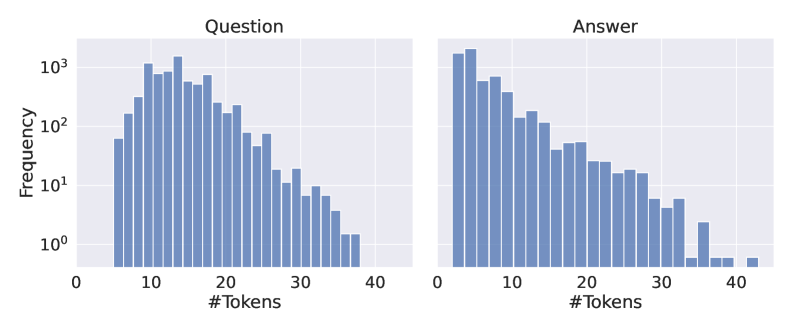
The image presents two histograms displayed side-by-side. The left histogram represents the distribution of token counts for "Question" data, and the right histogram represents the distribution of token counts for "Answer" data. Both histograms share the same x-axis scale representing the number of tokens, and a y-axis scale representing frequency, displayed on a logarithmic scale.
### Components/Axes
* **X-axis Label:** "#Tokens" (Number of Tokens) - ranging from 0 to 40.
* **Y-axis Label:** "Frequency" - ranging from approximately 1 (10⁰) to 1000 (10³). The y-axis is logarithmic.
* **Left Histogram Title:** "Question"
* **Right Histogram Title:** "Answer"
* **Bar Color:** A consistent shade of blue is used for all bars in both histograms.
### Detailed Analysis
**Question Histogram:**
The "Question" histogram shows a roughly normal distribution, but skewed slightly to the right. The peak frequency occurs between approximately 10 and 16 tokens. The distribution decreases as the number of tokens increases beyond 16.
* Frequency at ~5 tokens: ~50
* Frequency at ~10 tokens: ~200
* Frequency at ~15 tokens: ~350
* Frequency at ~20 tokens: ~250
* Frequency at ~25 tokens: ~120
* Frequency at ~30 tokens: ~60
* Frequency at ~35 tokens: ~20
* Frequency at ~40 tokens: ~5
**Answer Histogram:**
The "Answer" histogram also exhibits a distribution skewed to the right, but is more heavily skewed than the "Question" histogram. The peak frequency occurs between approximately 6 and 12 tokens. The distribution decreases more rapidly as the number of tokens increases beyond 12.
* Frequency at ~5 tokens: ~100
* Frequency at ~10 tokens: ~400
* Frequency at ~15 tokens: ~250
* Frequency at ~20 tokens: ~120
* Frequency at ~25 tokens: ~50
* Frequency at ~30 tokens: ~20
* Frequency at ~35 tokens: ~5
* Frequency at ~40 tokens: ~1
### Key Observations
* The "Answer" histogram has a higher peak frequency than the "Question" histogram, indicating that answers tend to be shorter than questions.
* Both distributions are right-skewed, meaning that there are more shorter questions and answers than longer ones.
* The logarithmic scale on the y-axis emphasizes the differences in frequency at lower token counts.
* The "Answer" histogram has a more rapid decline in frequency as the number of tokens increases, suggesting a stronger preference for shorter answers.
### Interpretation
The data suggests that questions, on average, are longer than answers. This is a reasonable expectation, as questions often require more context and detail than answers. The right skewness of both distributions indicates that while most questions and answers are relatively short, there are some longer examples. The logarithmic scale highlights the prevalence of shorter questions and answers. The difference in the rate of decline between the two histograms suggests that answers are more constrained in length than questions. This could be due to factors such as the need for conciseness or the limitations of the response format. The data could be used to inform the design of question-answering systems, for example, by setting appropriate length limits for questions and answers.