## Diagram: Sound Source Localization
### Overview
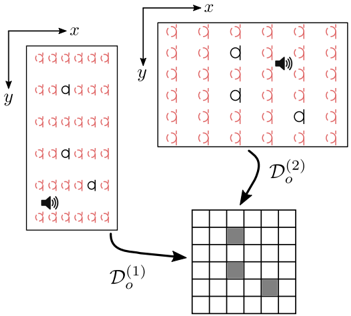
The image illustrates a sound source localization process using two different sensor array configurations and their corresponding occupancy maps. It shows how sound sources are detected and represented in a grid-based format.
### Components/Axes
* **Top-Left Array:** A rectangular array of sensors, oriented with the x-axis horizontal and the y-axis vertical. The array contains a mix of active sensors (represented by solid black circles) and inactive sensors (represented by dashed red circles). A speaker icon indicates the location of a sound source.
* **Top-Right Array:** A square array of sensors, oriented with the x-axis horizontal and the y-axis vertical. Similar to the left array, it contains active (black) and inactive (red) sensors, along with a speaker icon.
* **Bottom Grid:** A grid representing an occupancy map. Grey squares indicate occupied cells, presumably where sound sources are detected.
* **Arrows:** Two arrows labeled "D(1)o" and "D(2)o" indicate the transformation from the sensor arrays to the occupancy map.
### Detailed Analysis
* **Top-Left Array:**
* The array is arranged in 6 rows and 6 columns.
* The x-axis points to the right, and the y-axis points upwards.
* The sound source (speaker icon) is located near the bottom of the array.
* The active sensors (black circles) are clustered around the sound source.
* **Top-Right Array:**
* The array is arranged in 7 rows and 7 columns.
* The x-axis points to the right, and the y-axis points upwards.
* The sound source (speaker icon) is located near the top-right of the array.
* The active sensors (black circles) are clustered around the sound source.
* **Bottom Grid:**
* The grid is 8x8.
* The grey squares are located at approximately (2,2), (2,3), (4,5).
* **Arrows:**
* The arrow labeled "D(1)o" points from the left array to the bottom grid.
* The arrow labeled "D(2)o" points from the right array to the bottom grid.
### Key Observations
* The active sensors in each array are clustered around the sound source.
* The occupancy map reflects the location of the sound source in each array.
* The transformation from the sensor arrays to the occupancy map is represented by the arrows and labels.
### Interpretation
The diagram illustrates a sound source localization system. The sensor arrays detect sound, and the active sensors indicate the presence of a sound source. The occupancy map provides a simplified representation of the sound source location. The "D(1)o" and "D(2)o" likely represent different processing or mapping functions that transform the sensor data into the occupancy grid. The different array configurations (rectangular vs. square) may represent different sensor arrangements or experimental setups. The occupancy map provides a discrete representation of the sound source location, which could be used for further analysis or decision-making. The clustering of active sensors around the sound source suggests a spatial correlation between sensor activity and sound source proximity.