\n
## Diagram: Convolutional Neural Network Illustration
### Overview
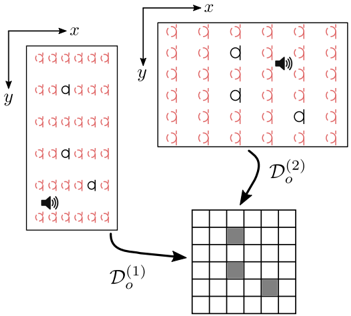
The image depicts a simplified illustration of a convolutional neural network (CNN) process. It shows an input matrix, a convolutional operation with a filter, and the resulting output feature map. The diagram highlights the effect of a filter sliding across the input, producing a smaller output matrix with activated regions.
### Components/Axes
The diagram consists of three main components:
1. **Input Matrix (D⁽¹⁾o):** A rectangular grid labeled with 'x' and 'y' axes. The grid is populated with the character 'd' repeated multiple times. A small speaker icon with sound waves emanating from it is present in the bottom-right corner.
2. **Convolutional Filter (D⁽²⁾o):** A smaller rectangular grid, also labeled with 'x' and 'y' axes. This grid is populated with the character 'α' repeated multiple times, with a few 'd' characters interspersed. A small speaker icon with sound waves emanating from it is present in the top-right corner.
3. **Output Feature Map:** A grid of squares, with some squares shaded in gray. This represents the result of the convolution operation. An arrow labeled "D⁽²⁾o" points from the convolutional filter to this output. An arrow labeled "D⁽¹⁾o" points from the input matrix to the convolutional filter.
### Detailed Analysis or Content Details
The input matrix (D⁽¹⁾o) appears to be approximately 5x6 in size. The character 'd' is the dominant element.
The convolutional filter (D⁽²⁾o) appears to be approximately 4x5 in size. The character 'α' is the dominant element, with a few 'd' characters.
The output feature map is approximately 2x2 in size. Four squares are shaded gray, indicating activation. The positions of the gray squares suggest the filter detected the 'd' character in those locations of the input matrix.
### Key Observations
The diagram illustrates how a convolutional filter slides across the input matrix, performing element-wise multiplication and summation. The speaker icons suggest that the filter is detecting a specific feature (represented by the 'd' character). The gray squares in the output feature map indicate the locations where the filter detected this feature. The filter appears to be designed to detect the 'd' character, as it activates when it encounters it in the input.
### Interpretation
This diagram demonstrates the core principle of convolution in CNNs. The filter acts as a feature detector, scanning the input for specific patterns. The output feature map highlights the presence and location of these patterns. The use of 'd' and 'α' characters is symbolic, representing any input data and the filter's learned weights, respectively. The diagram simplifies the process, omitting details like stride, padding, and multiple filters, but effectively conveys the fundamental concept of feature extraction through convolution. The speaker icons suggest that the detected feature is significant or noteworthy. The diagram is a visual aid for understanding how CNNs learn to identify patterns in data.