\n
## Scatter Plot: Human Aging Confidence vs. Target Length
### Overview
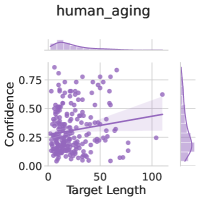
The image presents a scatter plot visualizing the relationship between "Target Length" and "Confidence" in the context of "human_aging". A regression line with a confidence interval is overlaid on the scatter points. Marginal distributions (density plots) are shown along the top and right edges of the plot.
### Components/Axes
* **Title:** "human\_aging" (top-center)
* **X-axis:** "Target Length" (bottom-center), ranging from approximately 0 to 100.
* **Y-axis:** "Confidence" (left-center), ranging from approximately 0.00 to 0.75.
* **Scatter Points:** Numerous purple dots representing individual data points.
* **Regression Line:** A purple line representing the trend of the data. It slopes slightly upward.
* **Confidence Interval:** A shaded purple area around the regression line, indicating the uncertainty in the estimated trend.
* **Marginal Distribution (Top):** A density plot showing the distribution of "Target Length".
* **Marginal Distribution (Right):** A density plot showing the distribution of "Confidence".
### Detailed Analysis
The scatter plot shows a weak positive correlation between "Target Length" and "Confidence". As "Target Length" increases, "Confidence" tends to increase, but the relationship is not strong.
* **Data Point Distribution:** The majority of data points are clustered towards the left side of the plot (low "Target Length") and have "Confidence" values between 0.20 and 0.50. There is a spread of points across the entire range of "Target Length" and "Confidence", but the density decreases as "Target Length" increases.
* **Regression Line Trend:** The regression line has a positive slope, indicating a positive correlation. However, the slope is relatively small, suggesting a weak relationship.
* **Confidence Interval:** The confidence interval is relatively wide, indicating a high degree of uncertainty in the estimated trend.
* **Marginal Distribution (Top):** The distribution of "Target Length" is skewed to the right, with a peak around a value of approximately 10-20.
* **Marginal Distribution (Right):** The distribution of "Confidence" is roughly symmetrical, with a peak around a value of approximately 0.30.
Approximate Data Points (sampled for illustration):
* Target Length = 0, Confidence ≈ 0.25
* Target Length = 25, Confidence ≈ 0.40
* Target Length = 50, Confidence ≈ 0.50
* Target Length = 75, Confidence ≈ 0.35
* Target Length = 100, Confidence ≈ 0.45
### Key Observations
* The relationship between "Target Length" and "Confidence" is weak and positive.
* There is considerable variability in "Confidence" for a given "Target Length".
* The marginal distributions suggest that "Target Length" is skewed to the right, while "Confidence" is approximately symmetrical.
* The wide confidence interval indicates uncertainty in the estimated trend.
### Interpretation
The data suggests that while there may be a slight tendency for "Confidence" to increase with "Target Length" in the context of "human\_aging", this relationship is not strong or reliable. The weak correlation and wide confidence interval suggest that other factors likely play a more significant role in determining "Confidence". The marginal distributions provide insights into the distributions of the individual variables, which can be useful for understanding the underlying data. The skewness of the "Target Length" distribution may indicate that the data is not normally distributed, which could affect the validity of statistical analyses. The "human\_aging" title suggests this data might relate to a model or process attempting to predict or assess age-related changes, and the confidence score represents the reliability of that prediction.